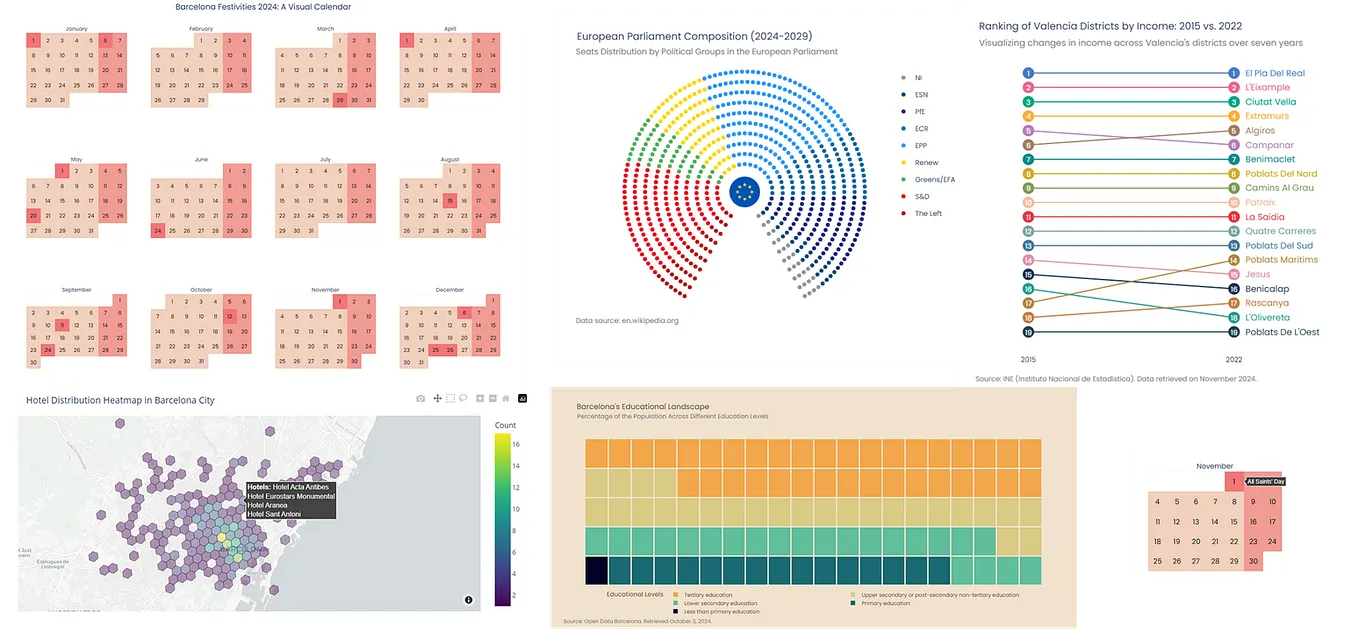
InData Science CollectivebyAmanda Iglesias Moreno5 Amazing Plotly Visualizations You Didn’t Know You Could CreateExplore Waffle Charts, Calendar Plots, Hexagon Maps, Parliament Diagrams, and Bump Charts for Advanced Data Visualizations in Plotly4h ago2
InTDS ArchivebyJo StichburyHow to build a Data Dashboard Prototype with Generative AIA book reading data visualization with Vizro-AIJan 272
InTDS ArchivebyJose ParreñoAwesome Plotly with code series (Part 9): To dot, to slope or to stack?Simple methods to replace cluttered bar charts with crisp, reader-friendly visuals.Feb 2Feb 2
InAI AdvancesbyHang NguyenBuild an Interactive IMDb Movies Dashboard with Streamlit: A Practical GuideUnlock the power of Streamlit and transform raw movie data into a dynamic dashboard1d ago1d ago
InTDS ArchivebyJose ParreñoAwesome Plotly with Code Series (Part 8): How to Balance Dominant Bar Chart CategoriesDiscover the #1 strategy to handle skyscraper bars in your chartsJan 147Jan 147
InData Science CollectivebyAmanda Iglesias Moreno5 Amazing Plotly Visualizations You Didn’t Know You Could CreateExplore Waffle Charts, Calendar Plots, Hexagon Maps, Parliament Diagrams, and Bump Charts for Advanced Data Visualizations in Plotly4h ago2
InTDS ArchivebyJo StichburyHow to build a Data Dashboard Prototype with Generative AIA book reading data visualization with Vizro-AIJan 272
InTDS ArchivebyJose ParreñoAwesome Plotly with code series (Part 9): To dot, to slope or to stack?Simple methods to replace cluttered bar charts with crisp, reader-friendly visuals.Feb 2
InAI AdvancesbyHang NguyenBuild an Interactive IMDb Movies Dashboard with Streamlit: A Practical GuideUnlock the power of Streamlit and transform raw movie data into a dynamic dashboard1d ago
InTDS ArchivebyJose ParreñoAwesome Plotly with Code Series (Part 8): How to Balance Dominant Bar Chart CategoriesDiscover the #1 strategy to handle skyscraper bars in your chartsJan 147
InPython in Plain EnglishbyAlexzapCreate 60+ Mind-Blowing Graphs, Charts, Maps & Animations with PlotlyPart-of-Whole Interactive Data Visualization in PythonDec 12, 20247
InData Storytelling CornerbyJohn Loewen, PhD5 Surprisingly Simple Hacks For Better Python Choropleth Map CreationGeospatial data viz methods using the global democracy dataset1d ago
InTDS ArchivebyJose ParreñoAwesome Plotly with Code Series (Part 7): Cropping the y-axis in Bar ChartsIs there ever a good reason for starting a bar chart above zero?Jan 53