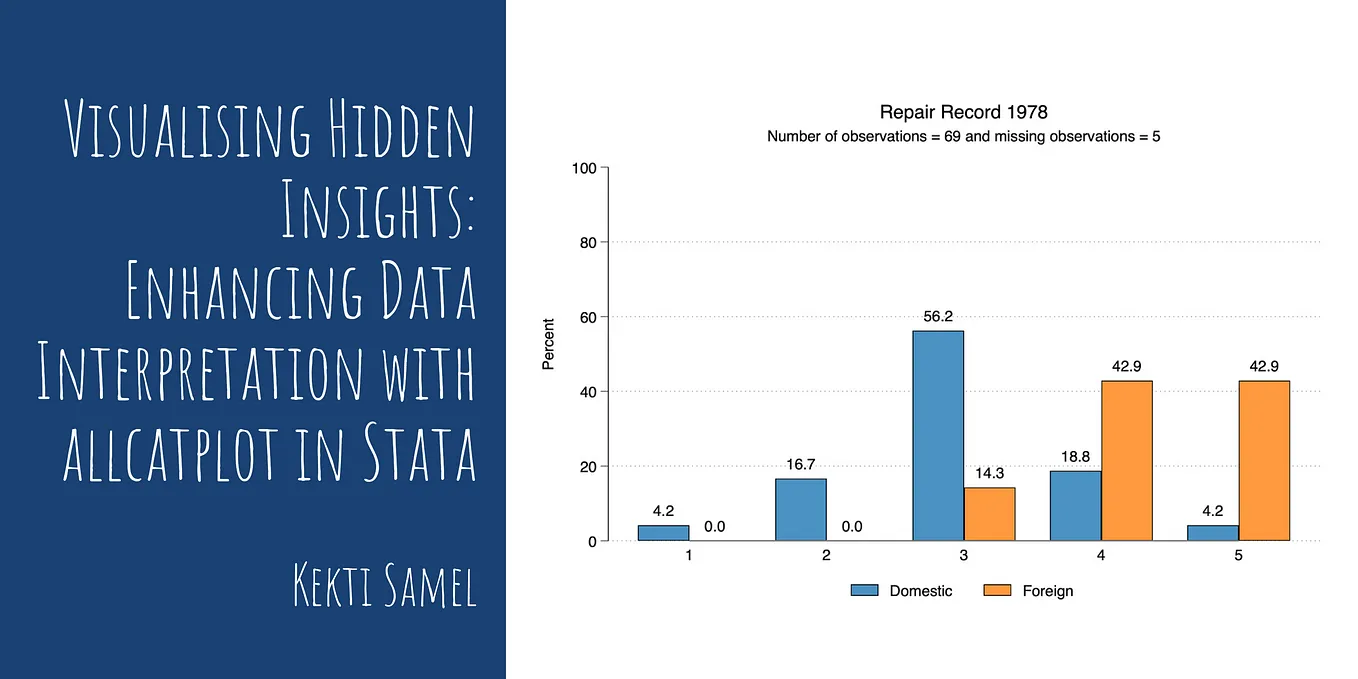
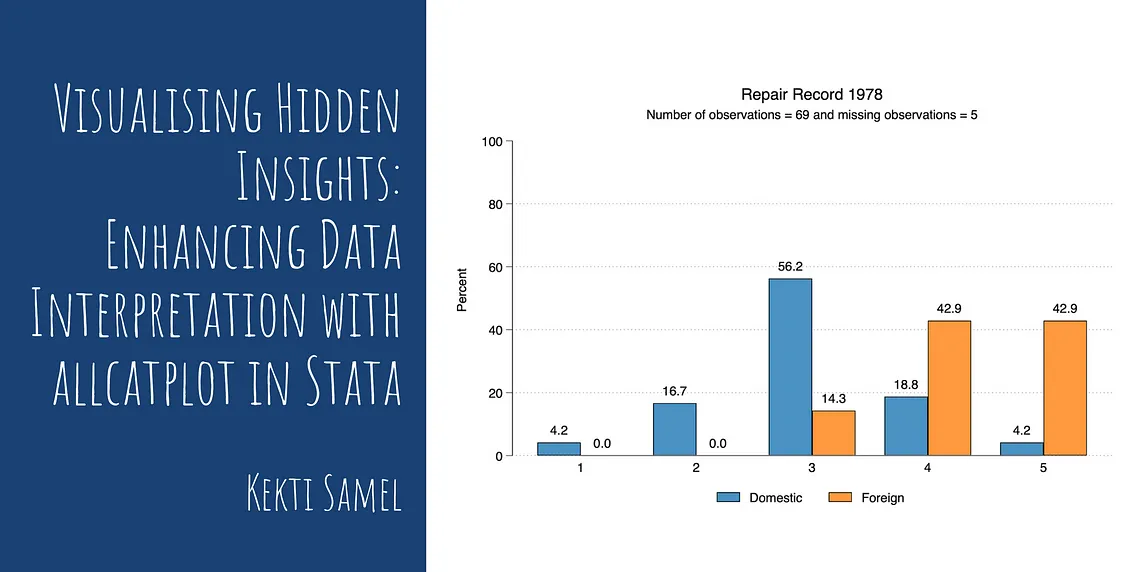
Ketki SamelinThe Stata GalleryVisualising Hidden Insights: Enhancing Data Interpretation with allcatplot in StataWhen analysing survey data with Likert Scales or predefined response categories, it is crucial to ensure that all potential responses are…5d ago
Adam Ross NelsoninThe Stata GalleryChoosing A Data Visual By Function Type — Stata EditionWhich-Chart-When, The Functional Approach For Stata UsersDec 12, 2023
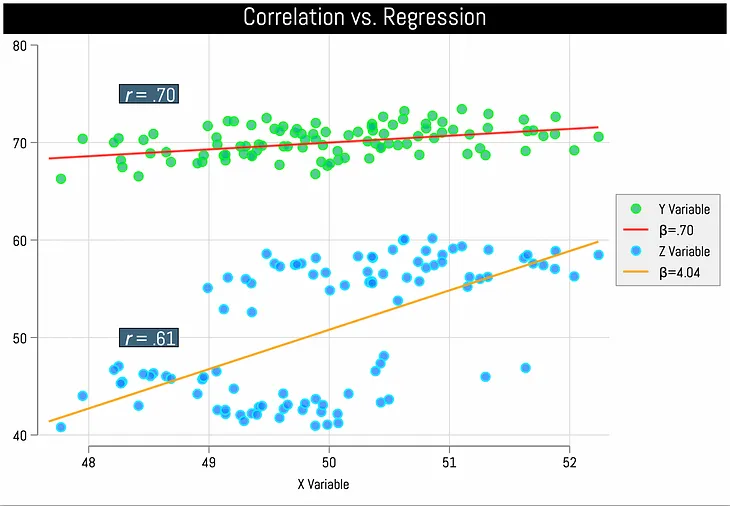
John V. KaneinThe Stata GalleryCorrelation vs. Regression: A Key Difference That Many Analysts MissCorrelation and regression analysis have many similarities, but they also have a major conceptual difference that analysts often miss.Apr 1710Apr 1710
Shritha SampathinThe Stata Gallerymean_ci_plot: It’s Means and Confidence Intervals all around!Mean and Confidence Intervals: A Peek into What the Data Holds5d ago5d ago
Asjad NaqviinThe Stata GuideThe Stata-to-LaTeX guideThe guide provides a set of templates for exporting tables from Stata to LaTeX. The LaTeX code is provided in a shared Overleaf document.Feb 25, 202110Feb 25, 202110
Ketki SamelinThe Stata GalleryVisualising Hidden Insights: Enhancing Data Interpretation with allcatplot in StataWhen analysing survey data with Likert Scales or predefined response categories, it is crucial to ensure that all potential responses are…5d ago
Adam Ross NelsoninThe Stata GalleryChoosing A Data Visual By Function Type — Stata EditionWhich-Chart-When, The Functional Approach For Stata UsersDec 12, 2023
John V. KaneinThe Stata GalleryCorrelation vs. Regression: A Key Difference That Many Analysts MissCorrelation and regression analysis have many similarities, but they also have a major conceptual difference that analysts often miss.Apr 1710
Shritha SampathinThe Stata Gallerymean_ci_plot: It’s Means and Confidence Intervals all around!Mean and Confidence Intervals: A Peek into What the Data Holds5d ago
Asjad NaqviinThe Stata GuideThe Stata-to-LaTeX guideThe guide provides a set of templates for exporting tables from Stata to LaTeX. The LaTeX code is provided in a shared Overleaf document.Feb 25, 202110
Shritha SampathinThe Stata Gallerydiff_plot: A Stata Module to Visualize Two-Period, Two-Group Differences-In-DifferencesCausality in the Social Sciences6d ago
John V. KaneinThe Stata GalleryAdvanced Bar Graphs in Stata (Part 1): Means with Confidence IntervalsJan 29
Juan Felipe Agudelo RiosMake Stata SE run fasterAs a student pursuing my master’s degree in economics and taking econometrics courses, I found the faster execution of Stata to be highly…Jul 1