Cmcc FoundationVisual narratives: From science to engagement through the European State of the ClimateMore than just colorful maps and eye-catching graphics. Data visualization enhances the readability of complex data, engages broader…May 16May 16
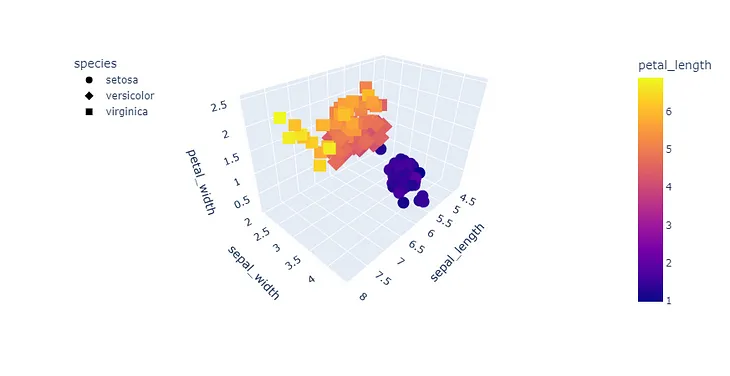
Henoch VitureiraVisualizing Data in 3D with Python, R and VR — Part 1Using plots and their capabilitiesJun 3, 20231Jun 3, 20231
Nita NagdewateWhich state in India has the highest number of missing women from 2016–2018?In this blog, I will write about the states in India that have the most missing women. We will do data analysis and visualization to see…Mar 30Mar 30
Cmcc FoundationVisual narratives: From science to engagement through the European State of the ClimateMore than just colorful maps and eye-catching graphics. Data visualization enhances the readability of complex data, engages broader…May 16
Henoch VitureiraVisualizing Data in 3D with Python, R and VR — Part 1Using plots and their capabilitiesJun 3, 20231
Nita NagdewateWhich state in India has the highest number of missing women from 2016–2018?In this blog, I will write about the states in India that have the most missing women. We will do data analysis and visualization to see…Mar 30
Vishakha Gupta-CledatinApertureDataAre Vector Databases Enough for Visual Data Use Cases?Vector databases solve one of the many data infrastructure problems encountered when working with visual use cases.May 3, 2023
Loicer Awino OtienoinBold BIEnhance Your Visual Data with Stacked Column Charts | Bold BIDiscover the secret of stacked columns in visual data analysis. Learn to leverage their power for clearer insights & smart decision-making.Jan 30
Elad YaakovinVisual LayerIntroducing VL ProfilerUnleash the full power of your visual dataJun 19, 2023