Why User Research will save you from doom [possibly] — pt2
What the heck is research anyway?
In part 1 I showed that skipping the research phase of your project can lead to disaster. Now I am going to share my view on what is research, and tell you a (my) hard truth: if it’s poorly planned or executed, then research is indeed a waste of time and money.
PART 2: DOING RESEARCH IS LIKE EATING BREAKFAST — if you eat junk food then you are in trouble

SO, WHAT’S USER RESEARCH?
Research can be defined as the discovery phase of your project, where you generate the insights which inform and direct design.
A practical outcome of research is reducing the risk of failure (I am not saying it will guarantee success) and providing directions to an optimal product by:
- Understanding users’ frustrations and their unmet needs (and yes, why not, also what they love)
- Finding out what the competitors are doing for those users (better check what the others are delivering)
- Identifying mavens and early adopters, as well as harbingers
- Testing hypothesis (and please note, I do not say validate, I say test)
and ultimately
- Supporting design choices with data (i.e. facts, not fluff and assumptions)
Very broadly, the research process encompasses 6 steps:
- Define a user problem
- Design your research (including choosing the appropriate methodology, questions, and what output it will generate)
- Collect data
- Analyse data
- Generate insights
- Disseminate insights
Nothing special here, but there are 2 points I want to make:
- Alas, easier said than done. If any of these steps is flawed, then research can indeed be a waste of time and money.
- You should plan your research backwards; I mean, think of how your research will be implemented to then find what type of research you need.
COMPENDIUM OF RESEARCH RISK AND PITFALLS
There is a plethora of pitfalls along the way, on the quest for the ultimate insight. Let’s highlight them covering the research process step by step:
1. Define a user problem. We have seen that the project is doomed from inception, when failing to define a user problem, when failing to understand customer needs from the beginning (see part 1). If in doubt, go back and read it.

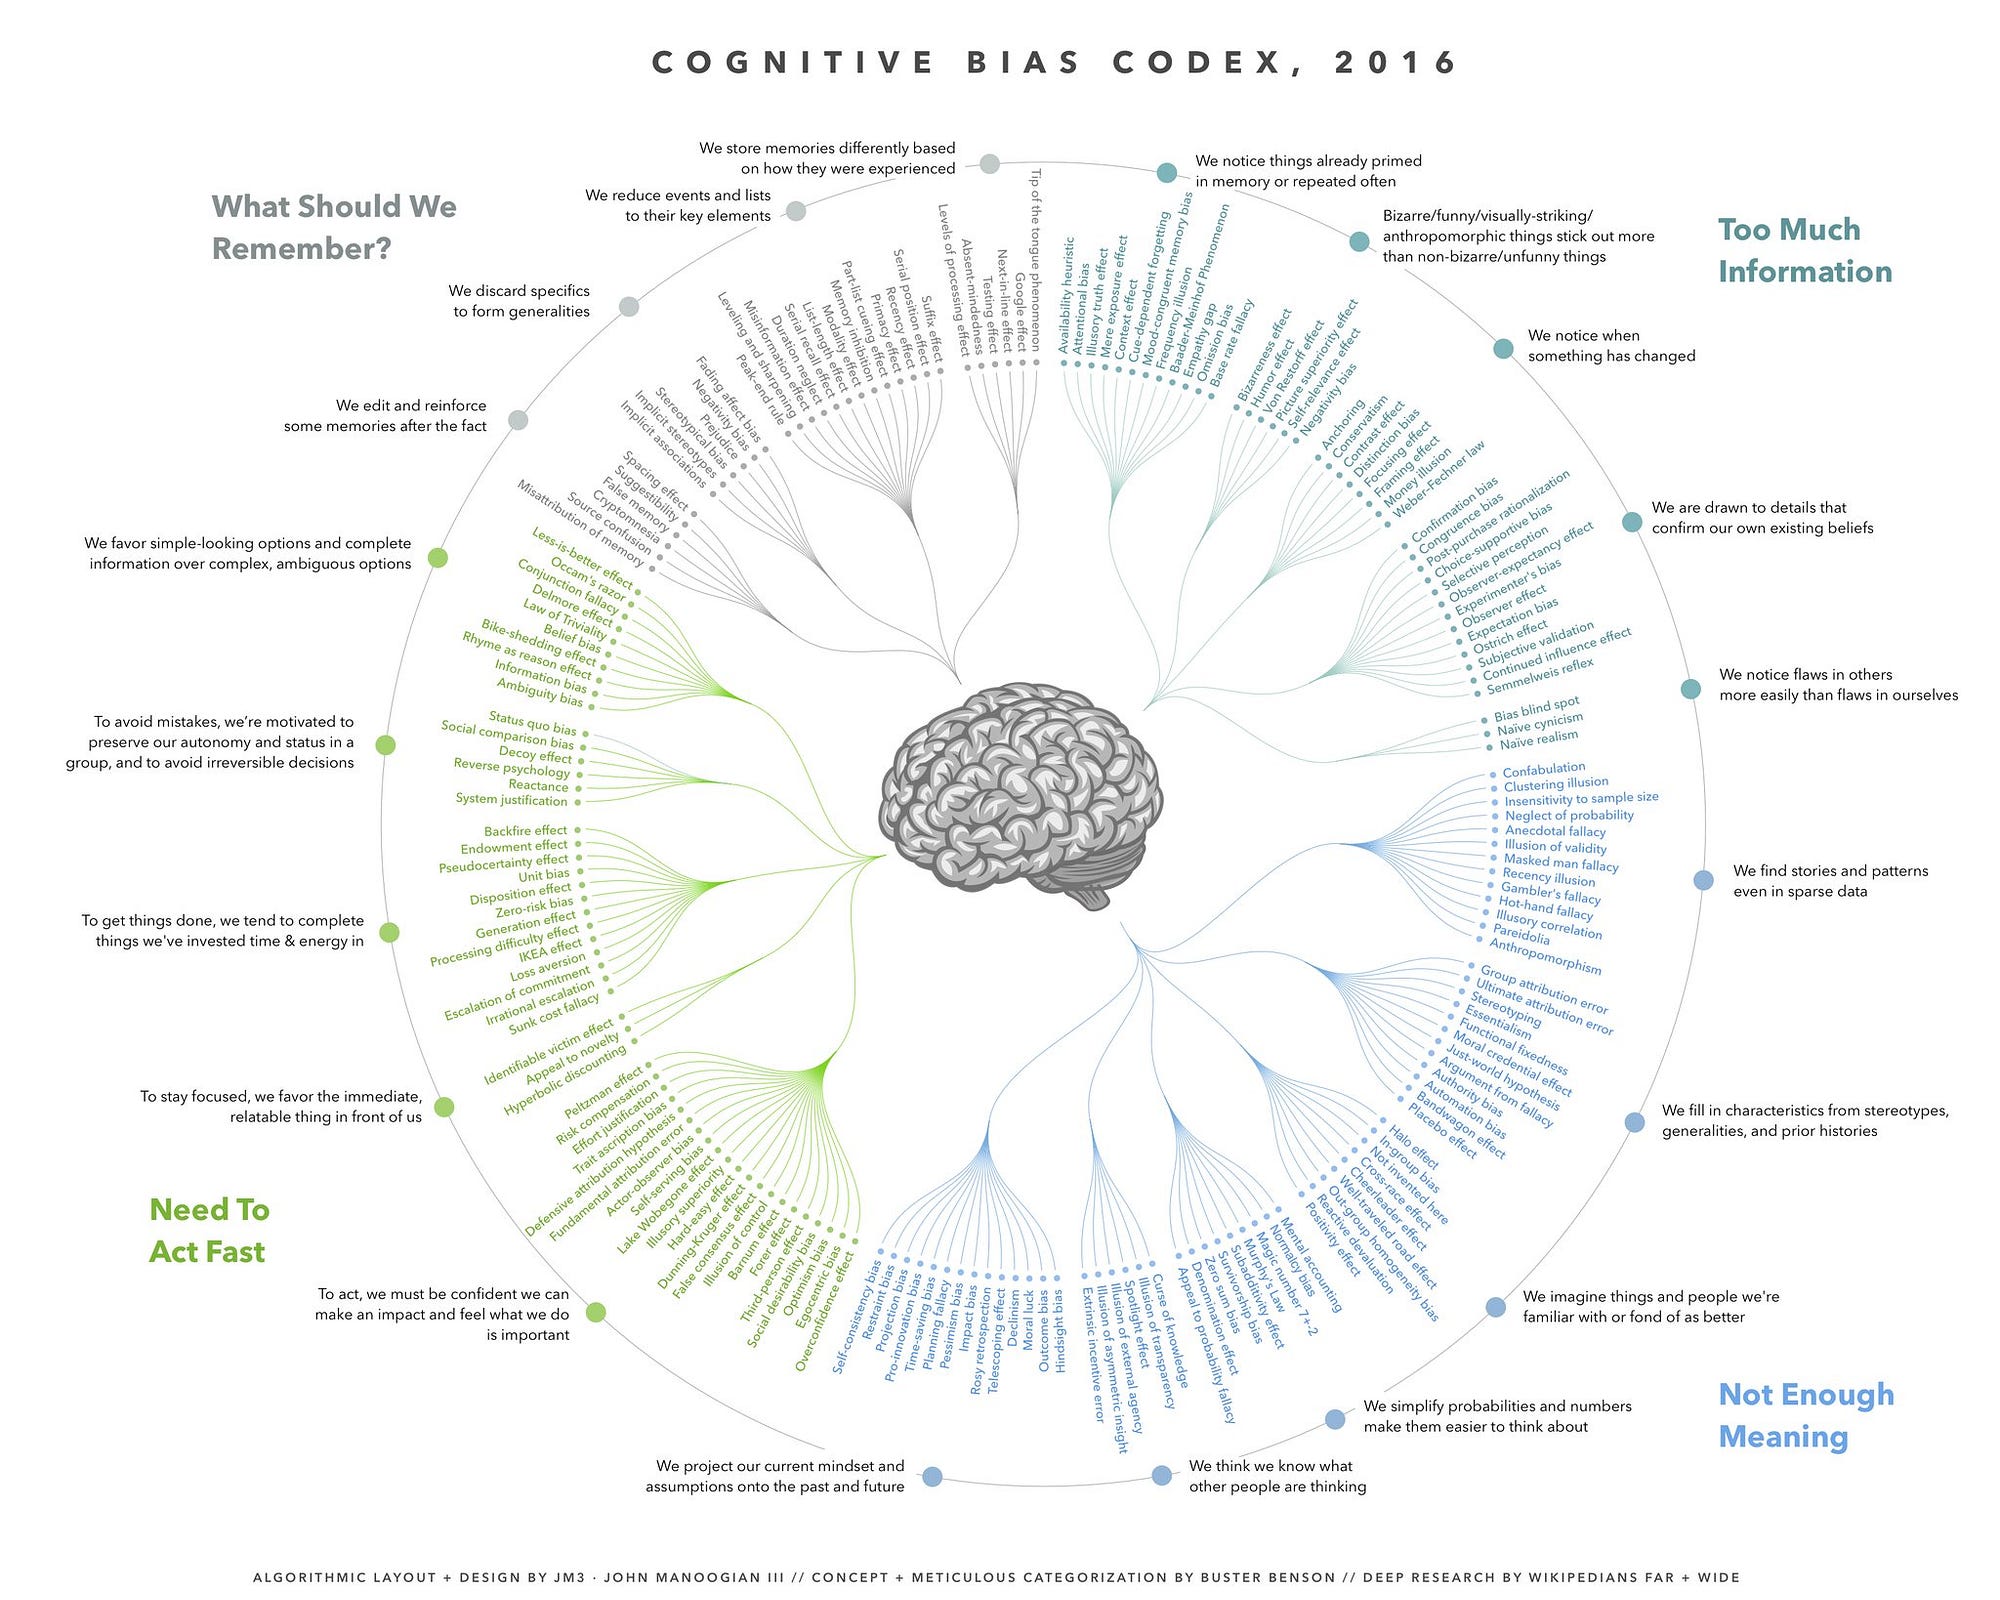
Why should you do research when you are an expert? Simple answer: experts fail. The point is that their knowledge is not usually deep enough, not up-to-date enough, and cognitive biases (my preferred is confirmation bias, sneaky little bastard) start slithering in. And all of a sudden you find yourself saying “users hate”, or “people love this” (have a read to this great blog post for more details).
2. Design your research. Choosing the wrong methodology to answer your research question can be fatal.
You’ve got a research problem. That’s great. Now, choose the right methodology. I will not enumerate research methodologies and when to use them. There are books and books covering it; what follows is rather a short collection of things I witnessed happening and struck me as odd.
Researchers tend to stick with what they know, the methodology they are comfortable with (sometimes the one they have to sell) and try to adapt the research question to the methodology, rather than the other way around. Understanding the whys beyond the whats and hows usually implies a qualitative stage, rather than a quantitative. On the other hand, it is useless to quantify a particular variable if the sample is not representative of the audience: “50% of us 2 think that I am right.”
For example, if you want to model the decision process and understand the drivers of choice, you will use a choice-based conjoint analysis methodology and infer the drivers through statistical modelling, rather than just ask to state the importance of different items, which usually lead to no discrimination between elements. In front of a battery of questions asking “How important is …?”, people will answer that everything is important (and fall asleep half way through).
The way we ask questions will determine the quality of the output; it’s the GIGO rule: Garbage In, Garbage Out.
And please stop calling the participant to a research piece a “respondent”: that makes you a “questioner”.

If your research is quantitative, what scale are you using in questions? I’ve seen scales featuring “Superior, Excellent, Good, Mediocre, or Poor”. Crikey, it is skewed towards positive comments. And what do the categories mean? Superior to … what? Is the semantic difference between Excellent and Good the same as between Good and Mediocre? If the survey does not provide a definition of these terms the results will be meaningless. And how dare you ask your customer their satisfaction about a malfunction, or service disruption? (see image, that’s a real survey). Then go on, ask “How satisfied where you when the steering wheel of your car stopped working?”
Moreover, at the analysis stage the categories are usually disregarded and everybody start calculating numerical averages (more on the curse of averages in a bit).

I received this satisfaction survey from my water company, featuring questions such as “How likely would you be to recommend using the mySouthEastWater site to friends or colleagues?” — the notorious Net Promoter Score. Luckily they gave the opportunity to comment, so I took the opportunity to remind them that the question is just rubbish as 1) water providers websites is not a topic of discussion with colleagues during after-work drinks or stand-up meeting nor with friends at the movies, pub or theatre, so I am not likely at all to recommend 2) You cannot really choose your water provider, so the question is meaningless per se.

And finally, what about those 30-minute long questionnaires filled with grid questions? They all sound the same and are dead boring. Grid questions are as toxic to participants as addictive to researchers.
Yeah, but in UX we do qualitative research, not surveys!!! Really? Go back and read again this paragraph. Moreover, it’s very easy to ask bad questions in qual research as explained in this great case study about the Denso Ecology Shoe.
I am reporting a bit of that story, here, as it amuses me every time I read it. If you are trying to understand the issues and frustration of cleaning a floor and ask questions such as “Would you like a clean house without the bother of vacuuming?” or “Would you like to clean your house simply by walking around it?”, well guess what? You would almost certainly back up the need for this amazing new product. Who wouldn’t want to make cleaning their home easier?

Et voilà the Denso Ecology Shoe, which has a small vacuum inside its very large, outer sole. At the heel is a small pedal, which is connected to gears. Every step you take powers the vacuum motor, allowing it to suck up small pieces of debris at a time (more details here).
Poorly formulated questions will lead to biased output, like close questions, which lead to a yes/no answer, or leading questions which suggest what answers should be, or misunderstood questions, which are not enough clear, concrete and simple
- Ask Open Ended questions: “Tell me about the last time you planned a holiday” rather than “Do you use a website to book your holidays?”
- Avoid leading questions: ask “Describe how you felt last time you booked a hotel online” rather than “Would you say booking a hotel online is frustrating?”
- Be generic enough, but do not give room for interpretation: Ask “Imagine you have a headache. What would you do to find relief?” rather “What kind of headache remedy do you use?” as the latter is prone to interpretation (Are we talking about a medicine? About “home” remedies? About a pill vs capsule vs caplet?)
In qualitative face to face research, you also have to consider the moderator’s facial expressions, body language, tone, and style of language: they all may introduce bias. Similarly, the moderator’s age, social status, ethnic background, and gender can produce biased responses.
A good way of limiting bias (at least in this phase) is to observe what people do, rather than listen to what they say. Sometimes there is a striking difference between the two. Read the famous story of the yellow and black Walkman.
3. Collect data. Talking to the wrong people will compromise the quality of your results.
Are you sure you are asking the right questions to target the right people? And even if you do, do you ensure you get rid of ‘professional survey takers’? Nowadays, the research world is inflated with so called cheaters — poseurs who misrepresent their identity, behaviours and attitudes, brands they use and so on. In a recent study (GRIT 2017 Global Sample Source Study, n=2687) 42% respondents claim to participate in research once a week or more often (whereas recruitment surveys usually are written to screen out people who participated to research in the last 6 months). That means 20% of respondents are providing 80% of the feedback. There are even advertising saying how to make easy money by answering surveys, and some professional qualitative participants have created blogs to share their confessions.
I will not venture into sampling and representativeness of the sample, as too technical, but when I receive an invite to a survey via Facebook and the aim of that survey is to represent the Australian population, well, I just roll my eyes.
4. Analyse data. Analysing data is a landmine field for researchers.
Let’s start quant: nowadays data analysis software is powerful and fast. Clicking a button, though, will give you back a number, rather than a result. “We interviewed 120 people and on average the satisfaction score was 6.43”. Then you find out that half of the sample gave very high scores, and half very low scores: the average is meaningless. I call it “the chicken average”: you eat a chicken, I eat none, so on average we have eaten half a chicken each (I am still hungry, though). You should have used non-parametric statistics. Why 2 decimals? And what if the scale was a categorical one? Those numbers are not quantitative values, but rather a categorical descriptions of quality.
Scroll back and take another look at the image about the satisfaction regarding the frequency of service disruption (and stop laughing): the average of your data is 2.78. Would you report something like that? Does it make any sense? It’s between Dissatisfied and Satisfied according to the labels. So what does it mean? I don’t want the internal stakeholder to get cross, so I’ll write “The average feeling regarding the frequency of service disruption is just shy of satisfaction”. Well done, turkey! Take a closer look at the categories and you’ll realise they are not symmetrical: that “Satisfied” should have been a “Neither Dissatisfied nor Satisfied”. So did the participants checked the box in the middle because they actually felt satisfied or because they simply did not care, possibly did not understand the question? Does a mean value have sense at all?
When it gets to qual data analysis, then you are less likely to be fooled by a software, but you have to stay on guard against your cognitive biases. The most dangerous is confirmation bias, when the researchers remember all points that support their hypothesis and points that disprove other hypotheses … and forget the rest.
I’ve been in focus groups (attending clients behind the notorious mirror) and witnessed the following situation:
- Researcher: so how do you feel about this (…)?
- Participant 1: I like it black because ….
- Participant 2: Yeah, I also like it black because ….
- Participant 3: I agree, black is better ….
- Client behind the mirror, mumbling: ah, they don’t understand, it’s not like that!!!
- Participant 4: I also like it black because ….
- Participant 5: No, I think white is better because ….
- Client behind the mirror, jumping: ah-ha, I told you so, white is better, this one understands it!! Good let’s move on.
No kidding. That’s a real situation. Enough said.
This article provides a good guide on how to avoid these biases. Have a read.
5. Generate insights. Data is part of the picture, but data must be interpreted in order to generate the insight. This is where incompetence and cognitive bias triumph.
Has anybody taught you how to generate an insight? Yes? Lucky you. You saved 5 years of your career.
That’s my recipe, by all means imperfect, so please do throw your pinch of salt in the soup, I am more than happy to amend it and learn from you.
RECIPE TO GENERATE INSIGHTS
So what’s an insight? Let’s start with what is not.
- Data is not an insight. “472 out of 649 people (73%) observed at the music festival threw all their trash away in the same bin”.
- An observation is not an insight, but rather a fact and it’s missing the “reason why”. For example “Despite having both general waste bins and recycling bins, at the music festival, people throw all of their trash away in the same bin”.
Let’s look at the context and add a motional why. “The different types of bins are poorly labeled. This confuses the music festival patron, who does not know how to participate in the recycling program”.
Insight can be defined as an accurate and deep understanding, an inner-sight connecting the behaviour to the motivation. Insights are conscious representations of the final processing of our intuition and instinct. It’s going from description to understanding, explanation and possibly — if not prediction — guidance. So how you get there? First of all with experience. Why? Because it is related to intuition and intuition itself is “nothing more and nothing less than recognition” as stated by American psychologist and Noble laureate Herbert A. Simon. Einstein, too, gave a similar definition: “intuition is nothing but the outcome of earlier intellectual experience”. Nothing magical there, a lot of hard work.
And here comes the recipe
- Set clearly what is the user problem that triggered the research and the context
- Generate patterns out of your data: key ideas, themes (that’s when you group your post-its). Generate relations between themes (predictions, correlations, identification of outliers)
- Connect observations to conclusions: This is the first actual part of the insight generation process. You start thinking about what these themes mean, why they are important, how they relate to the user problem, why things are happening the way they are.
- Describe implications: this is ultimately the rationale guiding your design. My advice is to place particular care in documenting this stage well; someone 1 year down the track must be able to understand it and take decisions based on them.
- Mention your assumptions: clearly stating what comes from research and what comes from assumptions set the limitations and boundaries. It’s more sincere and cuts the crap.
- Finalise insights: link your conclusions and implications to the business and user needs and state how the insight will drive action. Describe the new user journey which makes the user (and the business) happy. This makes it actionable, which is a primary property of an insight.
And please remember: a nice picture of a wall full of post-it notes is not an insight and probably should not even make it to the research report. Not even in the appendix.

HOW TO GET OUT OF THE RESEARCH MINEFIELD
“So, Robbie, what can we do? The picture you painted is so dark. You depressed me. Is it really worth doing any research, if it can be compromised at any stage?”
Well, first hire a professional (yay, my job is not redundant anymore). Then plan properly, starting from the end: what will your stakeholder do with the research results? What action alternatives will be taken? This is the second point I wanted to make in this post, but better moving it to part 3 (am I not a rascal?).
You survived part 2. Don’t fail me now, and follow me to the last part of our quest, where everything can be won or lost. I’ll cover how to plan your research and disseminate your insights.
