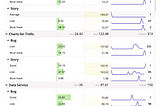
Oleg SeriagainVizydropGroups and pinned columnsWe are excited to introduce some new features for the table views.Mar 11, 2020Mar 11, 2020
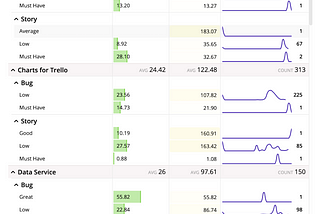
Oleg SeriagainVizydropOne report — many viewsHow to create several charts and tables for the same report data in VizydropDec 26, 2019Dec 26, 2019
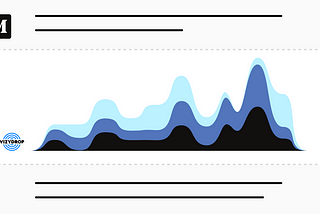
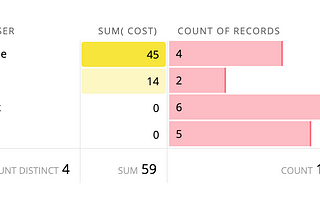
Oleg SeriagainVizydropMedium stories with interactive charts and tablesCommunicate data in your articles using interactive visualizations created in a simple and natural wayNov 25, 20191Nov 25, 20191
Oleg SeriagainVizydropReports for Jira: Visualize custom fieldsWe got published our add-on Reports by Vizydrop into Jira Marketplace a month ago and we are analyzing some user troubles in Jira related…Nov 15, 2019Nov 15, 2019
Oleg SeriagainVizydropPlug-in for Jira is live!Vizydrop plug-in is available in Atlassian Marketplace.Oct 9, 2019Oct 9, 2019
Oleg SeriagainVizydropVisualize data from JiraWe added the ability to create charts from Jira.Jun 24, 2019Jun 24, 2019
Oleg SeriagainVizydropTurn your Google Analytics data into chartsThe connector for Google Analytics has been added to VizydropMar 12, 2019Mar 12, 2019
Oleg SeriagainVizydropCustom data sources in VizydropHow to create custom data connector for AirtableFeb 25, 2019Feb 25, 2019
Oleg SeriagainVizydropCharts from Google Sheets using VizydropGoogle Sheets is very popular for creating spreadsheets. “Create, edit, and collaborate wherever you are“ as they said. Sometimes there is…Jan 31, 2019Jan 31, 2019
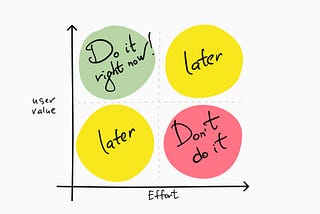
Oleg SeriagainVizydropPrioritization matrix with Vizydrop and TrelloHello, makers and creators. I bet everybody who was(is) involved in building products knows something about prioritization matrix. I am…Jan 15, 20191Jan 15, 20191