ZanBe as Cautious as Possible for the next 14 daysThis is the letter I wrote to family and friends this morning. Within 20 minutes I’d gotten texts from my friend who is an ER doctor and…Mar 15, 2020Mar 15, 2020
ZanA Sampling of Data VisualizationI wrote this originally for students studying CS at Burton High School in San Francisco, but figured I’d post on Medium to have the chance…Sep 19, 2018Sep 19, 2018
ZanOpen Data SourcesI recently taught a lesson on data visualization to a class of CS students at Lowell High School in San Francisco. One question was about…Apr 16, 2018Apr 16, 2018
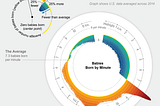
ZanStory Behind the Viz: The Baby SpikeWhen you first look at the visualization below, what do you notice first? The big spike? The colors? The shape? Something else?Nov 1, 20171Nov 1, 20171
ZanPart II: One set of data, many storiesOr, why a dual y-axis chart is not a normalized delta chartJun 15, 2017Jun 15, 2017
ZanOne set of data, many storiesIn March 2017, Brookings Institute put out a paper by Case & Deaton on Mortality and Morbidity in the 21st Century.Apr 3, 2017Apr 3, 2017
ZaninHi.StamenThe Shapes of EmotionsOne of the core visualizations in the Atlas of Emotions shows the range of states of each of the 5 emotions (anger, fear, disgust, sadness…Jul 27, 20162Jul 27, 20162
ZanWhy choose? Scrollytelling & Steppers“Scrollytelling” is an online storytelling technique in which more and more content is revealed as the user scrolls down the page.Jun 7, 20161Jun 7, 20161
ZaninHi.StamenExploring the Amazon with Code and DataA project with Stamen and National GeographicApr 6, 2016Apr 6, 2016
ZanTrouble, cunning, and a fighting spirit — the key to visualizing datatreasures from the past: AnscombeMay 8, 2014May 8, 2014