InfogramThe Complete Guide To Different Types of Charts – InfogramData visualization is a powerful tool for understanding and communicating information. And there are many different types of charts and…Jun 11Jun 11
InfogramInfographic dos and don’ts — InfogramInfographics are excellent visual storytellers. They can tell a story about practically anything, and complement it with meaningful data…Oct 21, 2022Oct 21, 2022
InfogramInfographic: The most valuable sports teams in 2019Every year, Forbes issues a report ranking the most valuable sports teams based on their collective profits from games, merchandise, and…Sep 3, 2019Sep 3, 2019
InfogramHow to stay focused, and quickly catch up on work after a vacationAfter months of planning and anticipation, you’ve finally taken that much-needed vacation. But once you’re back in the office, what do you…Sep 2, 20191Sep 2, 20191
InfogramHow to boost engagement using photo filters like a proSelfies with bunny ears and neon rainbow washes are nice, but your photo filters can do so much more — such as turbocharge the engagement…Aug 30, 20191Aug 30, 20191
InfogramInfographic: Back to School digital shopping habits 2019Summer is winding down, football fans are gearing up for a new season, and the kids are headed back to school. From preschool to college…Aug 30, 2019Aug 30, 2019
InfogramEnjoy the 20 Best Data Visualizations of 2018A beautiful visualization is the perfect blend of data, story, and design. But make no mistake — it isn’t easy to effectively combine…Dec 19, 2018Dec 19, 2018
InfogramTop 10 Infogram Projects of 2018December is our favorite time of year. Not just because the holidays are in full swing, but because it’s the month we put our heads…Dec 5, 2018Dec 5, 2018
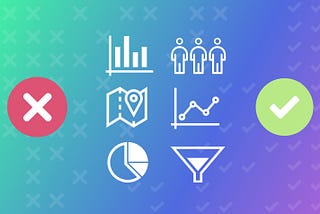
InfogramDos and Don’ts: Data Visualization Tips Before and AfterIn our ‘Do This, Not That’ series, we offer insight and best practices for the world’s most common chart types. For each chart, we explain…Nov 14, 2018Nov 14, 2018