Kailash HariinAnalytics VidhyaTime Series brief introduction and how to use interactive time series graph using dygraphsHere we are going to work on a Time Series data set that is on the inflation rate on Germany, where we are going to do some EDA work, then…Jan 14, 2020Jan 14, 2020
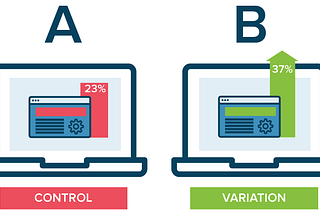
Kailash HariinAnalytics VidhyaA/B Testing Clearly ExplainedData Analysis: Credit Card Marketing CampaignOct 25, 20191Oct 25, 20191