Comic Sans: Project Collaborate
Updated by Tavish Grade
Hello everyone, we are Comic Sans — or rather, we are

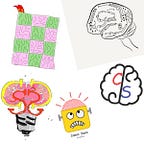
Those beautiful creations you see up there are our logos, each person on our team made one to represent the group. Ideas behind the logos came from mixing elements of cognitive science, computer science, and design. Our resident coder’s logo can’t be shown up here, considering it’s not simply an image. Check it out here

Speaking of our team, let’s introduce ourselves! We decided that our first order of business was to make a group photo. So, starting from the left we have: Joshua Miller, Tavish Grade, J Delaney, Jennie Yoon, Michael Hohl, and Daniel Jeong
The task given to us as Comic Sans, design group extraordinaire of Cogs 187A at UCSD, is to work collaboratively and create a finished product, either an app or a website. What that product will be, we had to decide on. So, we started brainstorming.
Phase 1: Brainstorming
During week 2 of our process, we all sat down and started throwing out project ideas, anything that came to mind. No idea was a bad idea to us. Our main focus was to not reject anything right off the bat, let each idea have a spot on our brainstorming board. Sticky note and after sticky note, we ended up with: The Wall of Ideas


27 project ideas total — we started to dwindle our list, take out the ideas that we didn’t find as much interest in moving forward with. We did this based on a voting system, each person had so many votes each round.
The ideas that didn’t have enough votes at the end of each round were thrown into a different pile…
The Pile of Forgotten Ideas
…and the better pile of forgotten ideas
…and the even better pile of forgotten ideas
Until we were left with the big three — the Best Ideas
Phase 2: Focusing
Our top three ideas that we ended up with were —

— — — — — — — — — — — — —
4-Year Planner
Sport/Workout Meetup
Connect Designers and Coders
— — — — — — — — — — — — —
At this point, we still didn’t know which one to pick, so we turned to our trusty TAs. Three of our advisors came in, we told them about our ideas, what we might be envisioning for each of them. While we were talking about all three of them, it became pretty clear to everyone which one we were all the most passionate about, the one that resonated with us the most, even the TAs. We all were leaning towards: Connecting Designers and Coders. Even talking about it, we were all thinking back on the tough experiences we had trying to find designers and coders to collaborate on a project with — it only made sense to move forward with an idea that was more personal to us. Which leads us to:
Phase 3: More Brainstorming
There can never be too much brainstorming. This time we wanted to write down every single idea or vision we had about the Connecting Designer and Coders project idea. No idea was a bad idea. Even if we had inhibitions or questions about implementation we stopped ourselves and simply said,
“Put it on the board.”

By the end of our session, we had tons of ideas about what profile content is needed, how information could be shared between users, especially from different backgrounds, ways to find someone fit for your type of project, and many more.
We knew our ideas were simply that, ideas. They needed to be grounded in some data driven analysis. Which leads us to our last step of week 2:
Phase 4: Data Collection

Right before we ended our working sessions for the week, we decided we would each go out and interview at least one person before next week about what they look for in a designer/coder, their past experiences, good and bad, and the limitations they have on their own projects that they need help on.
Our future plans for next week are to go over the interviews we’ve collected, see what people are saying, let that affect our next step of brainstorming, get more data, do it all over again, etc. Our project for this class has just begun, and thank you for joining us on our journey.
And now, pictures of us smiling and having fun:

PHASE 5: Storyboards & Personas
Updated by Daniel Jeong
Week 3: For the past week, our team has developed different personas based on people we’ve interviewed. As previously planned, we each derived personal narratives from our interviews and decided to continue our project from a user-centric perspective.

And the result?


Each of us produced unique perspectives of different users: Halen who lives in the middle of nowhere but wants to be virtually involved in a project, Bear, a working professional looking for a side project, and Alfonse, a stay-at-home parent who has incredible ideas but little to no design/code skills are a few examples of our established personas.
While our characters range from “star people” to animals, these personas are based on actual qualitative research we’ve conducted via face-to-face interviews. This is important to note because we want you to understand that the purpose of personas is to create reliable and realistic representations of users.


After having established our personas, we were better able to move along the development process. Specifically, we:
- understood that translating skills between a coder and designer is tough (logical vs. abstract)
- identified users who aren’t interested in actively searching projects but rather use the app on casual terms
- came up with the idea that project managers play a crucial role in project development
- started thinking of the architecture and key components of the app
PHASE 6: CRITIQUES & FEEDBACK
To garner additional feedback, our group presented the project idea and storyboards to another group. Several suggestions included:
- incorporating icons/badges to promote an interactive dimension
- using a messaging system (direct/group-based)
- allowing reviews/endorsement but disregard the ability to post negative reviews
The next step is to brainstorm and make distinctions between key features of the application and add-on functions to enhance user experience.
With that said, we will end this week’s update with a photo and Jennie and Daniel smiling and having fun:

Phase 7: Prototyping
Updated by Jennie Yoon
Week 4: After weeks and weeks of brainstorming, data collection, and personas/storyboards, we finally saw our ideas come to life! It was a rough skeleton but nevertheless, a living skeleton (all in the spirit of Halloween!). But of course, before we even began sketching out our lo-fi prototypes, we had more brainstorming to do. First, we needed to identify the type of webpages that the users would need:
- Homepage: A simple homepage to search for coders, designers, and projects. Possible newsfeed once the user has logged-in.
- Profile Creation: Easy profile creation.
- Profile Page: A description of the user that highlights their skills and experience. Able to send messages and/or follow users from profile page.
- Project Creation: Project leader or team creates project with information.
- Project Page: Description of project. Team member search, invites, and request for invite.
- Help: FAQs and contact page.

With the top features of the site in categorized lists mapped out, we worked on the flow of the webpages.


The Journey Map
This map was the turning point in our project- where ideas were transformed into tangible models. Excitement drove us to self-assign extra homework where each person:
- Needed to sketch their vision for the homepage
- Should redesign or refine the “Journey Map” (Flow Chart)

When we reconvened on Thursday, we shared and compared our own “Journey Map” and ideal homepage.
We agreed that we liked a simple and clean webpage where the content would speak for itself. We also liked the idea of using a video background to create a subtle yet immersive experience.

The flow chart
Begin with “Homepage”:
- The first time would lead into making your profile
- Otherwise would lead you to the search text-box
- From either the search box or the make your profile page you can transition to the make your project page
- You can also transition from search to view profiles.
- Viewing profiles is how you can meet people!
- From profiles you can message people
- You are also able to follow people
- You also can follow projects as well as join in on projects
- The end goal is…to make killer projects!


All work and no play makes Jack a dull boy
With that said, say hello to our resident Cogs 187A mascot, Poly! Here she is gracing us with her majestic fluffiness.
PHASE 8: Detailed Prototyping
Updated by J Delaney
Week 5: During phase 7 everyone came up with their own prototype of how CodeSketch should look. Using these we were able to come up with synthesize our ideas into a high-quality prototype that was suitable for user testing.

Our new prototypes featured more details, cleaner design, and a unified structure.
By taking the best of everyone’s personal prototypes we made a wonderful design.
While we spent a lot of time on paper prototypes, we also discussed things that can’t be accurately portrayed on paper: transitions. None of us wanted traditional labels for text boxes. They’re cumbersome, take up valuable space, and didn’t mesh with our design. We wanted something a bit more flexible. Taking inspiration from Android we came up with a good solution:

User Testing
Armed with high-quality prototypes we set out to see how actual users would deal with them. Luckily, our entire class is full of people who match the personas of our future users.

Two testers ran through our website. We wanted to keep it as realistic as possible so we placed the paper in front of a computer. A blank sheet of paper covered the content that our testers had to “scroll” to see


Our testers provided valuable feedback while they navigated our site. They pointed out what they liked and what they didn’t. Watching them hit issues and get confused was valuable in helping us realize what areas made sense to us, but didn’t make sense to everyone else.
We learned that our search filters were a bit confusing while our methods of bridging the knowledge gap between designers and coders was top-notch.
We ended the week on a great note: with the discovery of googly eyes. We used our finely honed design skills to put these to good use:

PHASE 9: User Testing
Updated by Joshua Miller
Week 6: During phase 8 everyone teamed up to agree on a final prototype design to allot to user testing. Each of us played critical roles in combining what works and what doesn’t from our design, and we found out how we did through much user testing and feedback.
Our final prototype featured even more details, a clean design, and a unified structure, much like the previous iteration.
“By taking the best of everyone’s personal prototypes we made a wonderful design.” This truly shined in our final iteration of prototyping.

While we spent a lot of time on adding to our paper prototype to prepare it for user testing, we also took the time to begin site mapping it to be able to get a grasp on the code required to bring our prototype to life.
User Testing Round 2
We set up our prototype to usable in a natural environment. We wanted our users to have the realistic experience of using our prototype as a website on a laptop.


Of course, to encourage user testing we had to bring along snacks to attract able, potential users.
It Totally worked.


We really did learn a lot from our user testing. We gathered a lot of user testing feedback that is currently helping us finalize design choices so we can implement our site.
We look forward to sharing our product with the world!

PHASE 10: Hi-Fidelity Prototyping
Updated by Michael Hohl
Armed with buckets of feedback from user testing, we set out to reiterate our product designs — this time with hi-fidelity prototypes.

We started by sifting through the data we had collected during user testing. Our data included notes, audio, and video footage. We compiled all the feedback we had received by sorting it into categories based on the product’s features and screens.
Next, we used our feedback as critique for our product. Challenging our designs became critical at this stage:
“What’s a better way to visually display one’s skills on their profile? Does it make sense to include one’s time commitments on their profile?”
As we discussed and sketched out our responses to questions like these, we worked to reiterate our designs based on feedback from user testing. After finalizing some decisions about various design choices, we began building hi-fidelity prototypes on Axure.

We are currently working on our hi fidelity Axure prototypes. However, since our homepage had very few changes to make after user testing, we went ahead and quickly completed the Axure prototype for it and developed it into a webpage prototype!

As we started work on our Axure prototypes, we wanted to maintain consistency across our website. So, we’ve made master elements like navigation bars to ensure uniformity among all the pages, and we’ve developed a “style guide” to ensure that we use consistent fonts and coloring. Once all the Axure prototypes are complete, we hope to iterate through one more round of user testing to tweak any final changes. We’re excited to be approaching the final stages of design before we dive into development!
Phase 11: Implementation
Updated by: Daniel Jeong
We have now approached the latter stages of product development. Our team has been busy designing and uploading hi-fidelity prototypes via Axure. This week’s focus is to ensure all aspects of the website (i.e links, photos, and other design elements using HTML/CSS/JS) are active and functional.
During our group meeting, we discussed more granular-level logistics such as displaying a “skills graph” that allows the user to select + rank his or her ranking of skill (novice, proficient, expert). Check it out below:

Moreover, due to the high functionality of our website, we have narrowed our focus to these “must-have” pages that still allows the users the flexibility to search, create, and connect.

Our decision to focus on these 8 pages was essentially based on the question of what the users need (derived from user-testing/feedback) as opposed to what the users may enjoy (other back-end and extrinsic properties such as geolocation or visual interactions). Agile development is especially important because we want to make sure the basic properties of our website is functional before adding the “cherry on top.”
But don’t worry.. our team is working hard on all dimensions of the project so that we will have a complete product before we present it next week.
Here are a few photos taken during our meeting this week:

Phase 12: Into the Shark Tank
Updated by Jennie Yoon and J Delaney

Welcome to the final phase of CodeSketch (at least in Cogs 187A)! The last 9 weeks of our ideas, rough sketches, personas, storyboards, lo and hi-fi prototypes finally reached the implementation level. This important stage was left mainly to our fantastic coders and visual designers who brought the project to life!
There were a lot of back and forth between the coders and designers in our group. Each little interaction made CodeSketch more and more polished.
Cinemagraphs and Mugshots
The idea of adding cinemagraphs to our homepage never wavered throughout the past 9 weeks.
We always loved the idea of a motion background to draw users in.
We spent the day at the beautiful Galbraith Hall in UC San Diego shooting our video. We chose this location for its modern architectural features and the collaborative feel it had.

Our field trip away from our usual lab space put us in a fun and festive mood (just in time for the holidays)! As you can see, we had a lot of fun shooting our cinemagraph. Here’s an exclusive behind the scenes look:


Since we had a nice camera on hand, we decided to take some head-shots for our project and personal use. We thought it was a nice bookend from our first “photoshoot” when we all first started to work together.

We used Doodle to figure out a time to work on our final presentation (by the way, it’s a great tool for meetup times!). With our meeting time in place, we plan on finishing our presentation and getting ready to plunge into the Shark Tank!
The Shark Tank
Preparations for Shark Tank were intense. We built a rough outline of our presentation to figure out what content we wanted to go over:

After deciding how we wanted to structure our presentation, our top-notch graphic designers overhauled the slides to make it look absolutely spectacular:

Luckily, we were going on the last day of Shark Tank. This gave us time to learn from what other groups did. We quickly realized that we would have to optimize for the fact that the projector had both a low resolution and low contrast.
We added finishing touches to our website — including an awesome cinemagraph on the homepage.
Finally, the day of the presentation came. We met up at 6:30am to practice and make sure everyone knew what they were doing. The presentation went smoothly and was a success!