Application of Modern Portfolio Theory on Cryptocurrencies
Portfolio Optimisation : A cryptocurrency story
We apply MPT (Modern Portfolio Theory) to a universe of cryptocurrencies. The MPT evaluates the optimal weight for each asset in the portfolio such that the overall portfolio risk is minimised. MPT is a very well-known process but for the ones who are new to this, we have provided a brief overview:
Identify Universe
n risky assets {S1, S2, … Sn}
where S(t) → The current price of the risky asset, Today → (t)
S(t+τ) → The price of the risky asset in the future, Future → (t+τ)
Expected Return

Expected Risk

Portfolio Risk

Optimal Portfolio

Universe
Cryptocurrency market currently stands at $200 billion dollars https://coinmarketcap.com/charts/
A huge market, however a relatively young market with a plethora of new products arriving every day. For any meaningful time-series analysis it is important to have a good set of historical data. For our purpose here we have chosen coins which are in the top 20 market cap and have existed since 2016, namely BTC, ETH, XRP, LTC, DASH, XEM, XLM, XMR, EXP and XPM.
Non-intelligent Portfolio
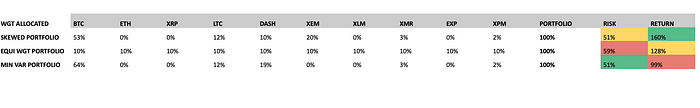
‘Do not put all your eggs in one basket’ — a very well known proverb. The simplest well diversified portfolio is to put your investments in a collection of assets. Figure 1 shows our risk and return of our equally weighted portfolio. It has a respectable sharpe ratio of 2.18 but also a nail biting risk of 59%, not for the faint-hearted!

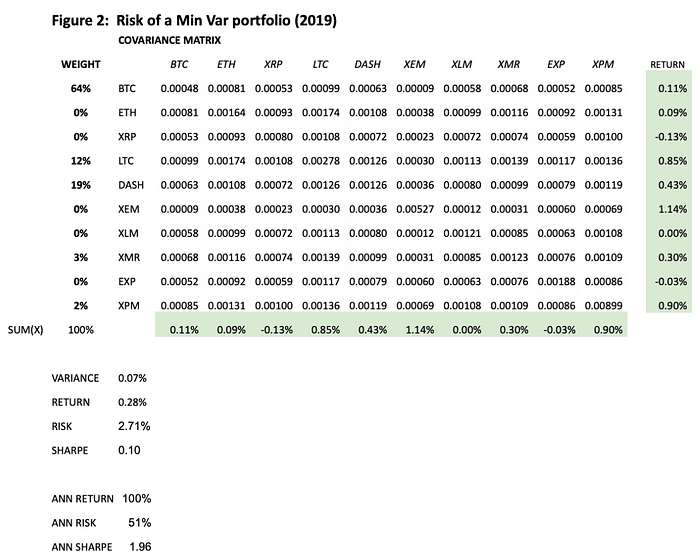
Minimum Variance Portfolio
We use MPT theory and develop a portfolio optimised for lowest risk as described in the introduction. As seen in Figure 1, BTC, DASH, LTC, XMR and XPM are included in the portfolio i.e. given considerable weights however, all the other coins are excluded from the portfolio i.e including them will increase risk, with no improvement in returns. The biggest weight is given to BTC, followed by DASH, LTC and then XMR, XPM. It is not surprising that such a large weight is given to BTC. Given the first mover advantage, large liquidity and acceptance, it has become the gold standard of cryptocurrencies. Looking at the correlation matrix (Figure 11) we can see why the optimisation model has selected these coins — there is quite low correlation between them, a recipe for portfolio diversification.
Given this, we can see that our risk in Minimum Variance portfolio has reduced from 59% to 51%. A decreased return is observed leading to a reduced sharpe ratio of 1.96. This shows that for every unit of risk our return is a multiple of 1.96.
Skewed Weights Portfolio
Can we make our portfolio more intelligent? One drawback of MPT is that it is based on historical returns i.e. it has no foresight to what the market could possibly do or for that matter even current market conditions foresight.
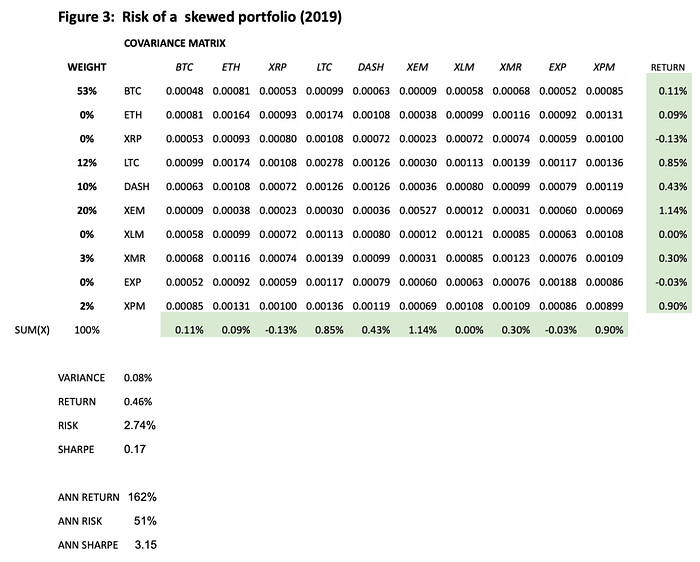
To generate superior alpha from the market, we use our proprietary internal research models to further shape the weights of our portfolio. Our proprietary models include technical and fundamental based alpha factors. As of Jan-2019, our proprietary models were indicating us to be overweight in XEM and LTC. We incorporated this signal in our Minimum Variance Portfolio by increasing the weights in our portfolio. We took the weights of minimum variance portfolio as the base to start and re-allocated weights from BTC: 11% and DASH: 9% into XEM to get a total allocation of 20% in it.
We increased our Min var portfolio risk by 1.5% to gain 72% return in the Skewed Portfolio.
Portfolio Comparison:
Portfolio return comparison.
We went live with the Skewed Variance Portfolio in Jan-2019. Since then we have observed returns of (46%) and a risk of 2.77%.
As seen in Figure 4, the return in our skewed portfolio is higher than the other two portfolios. Its volatility remained lower than that of the other two portfolios till the third week of Jan, after which it surpassed the minvar portfolio to spike again in March week 2. Our MinVar portfolio had a downward trend
Portfolio risk comparison.
Monthly performance: Individual assets vs our chosen portfolios:
A monthly split of each assets total return is displayed in Figure 5. As seen in the figure, the monthly performance for Jan 2019 was quite low as compared to the other two months.
Amongst portfolios- the best performance is given by our skewed portfolio -8.34%, followed by our Min Var performance of -12.81%. For the month of february- it had a return of 10.07% higher that of all coin average of 8.84%. The following month (in March) it gained a return of of 33.38% 2nd to
Monthly Performance: All three portfolios
Now let’s look at how each of our selected coins performed since Jan-2019. For clarity we have indexed all coins to 100 from Jan-19.
XEM has been the best performer in this period with returns of 121%. It is worth mentioning that XEM has only performed in the month Mar-19 prior to which the performance has been lac-lustre and even negative. XEM has been on a downward trend since first week of Feb-2019, a loss of nearly 40%! The volatility for XEM has been on a downward trend as well, in fact in Feb-19 it was one of the lowest volatile asset and only spiked up in Mar-19. Correlation has been pretty low versus all the other coins in the basket, except XPM where the coins correlation increased in Mar-19.
LTC is our next best performing coin with 89% return. LTC was quite low until the first week of February after which it increased by 41% and then peaked again during Mar-19 by 28%. Also it is worth noting LTC and XEM have low correlation of -26%- ie. having weights of LTC and NEM in our portfolio might give us lower risk.
XPM has been the worst performing coin with a loss of 40%, up till the last week of March — when it spiked up by 137%
- some assets, ETH and XPM went down by 20%. While others such as LTC and EXP, return stayed under -10%.
Figure 5: Monthly performance 2019
Volatility
XPM has been our most volatile asset since Jan’ 19 with volatility of 10%. The volatility has been seasonal, with Jan volatility decreasing from a high of 15% to 5%, then peaking again to 10% in Feb followed by a massive spike in March of 18%.
LTC has been our next most volatile asset 5%, the volatility rate peaked up at 10 Feb- and stayed up until 2nd week of March, post which it started falling.
XEM started with a volatility of 7%, decreasing until mid Feb to 2% and then increasingly steadily to a high of 14% end of March, rivaling XPM’s volatility.
DASH and BTC- have been our most stable assets with volatility lying below 6% throughout.
Our skewed portfolio in comparison to these individual assets has a volatility rate which lies below 4%.
Figure 4: All coins vs Optimised Portfolio
Correlation:
The following table in Figure 8 shows a very high correlation between BTC- ETH, BTC-DASH, BTC-LTC BTC-XMR. And a low correlation between BTC-EXP, BTC-XEM, XEM- ETH, XEM-XRP, XEM- XLM, DASH-XRP, XRP-LTC, XRP-XEM, ETH- XEM, EXP- LTC
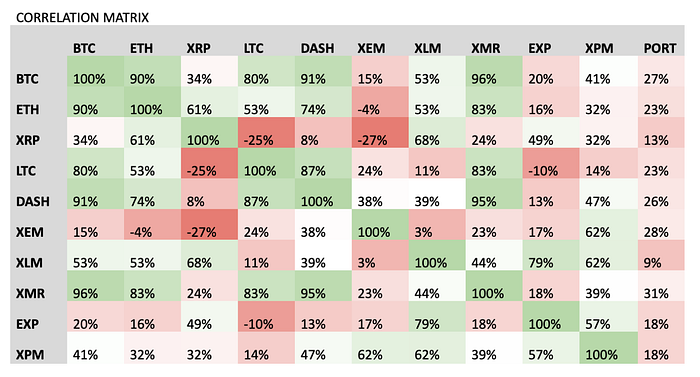
It seems like the correlation of XEM is the lowest with the other coins present in the basket. This is another indicator of why adding XEM to our skewed portfolio gave us a higher return. Interestingly our portfolio also has a low correlation to all the other individual assets in the portfolio- which is again a great indicator of a stable portfolio.
Conclusion
Below I have pasted a live link of the skewed portfolio- from where you can monitor its live performance. Here.

