Animated design.
Have you seen the gorgeous animations on the Global Forest Watch Topics pages? We’d like to tell you how and why we made them. It was a process that united art, science and technology to create a captivating entry point for data exploration.

Opening up the path to knowledge.
Forest loss is a complex issue. Trying to understand everything all at once can be overwhelming. To help first-time visitors to Global Forest Watch learn more about deforestation and guide them towards independent data discovery, we wanted to design an introduction that not only looks great but is rooted in science and viewable on any device.
Animation is a great way to introduce people to new or complex topics because the moving images are more engaging and memorable than still ones. However, there are a few things you need to consider if you’re thinking about using it. I asked Estefanía Casal, the designer of the animations to tell me more about the process.
Set out your objectives.
When we began designing these animations, we had three things in mind.
- Simplicity. The animations have to be an entry point for people who aren’t forest experts.
- Representative: The animations need to be more than just pretty, they have to be a faithful representation of the topics.
- Performance: The animations have to be viewable and usable on any device, regardless of processing power or bandwidth.
Simplicity.
“Good design should attract, not distract, a person from the data or insights you want to share with them,” explained Estefanía. “With this in mind, we thought a minimalist style would work well for the animations. Our designers and developers have experimented before with isometric projection—a method of visually representing three-dimensional objects in two dimensions—so we decided to build upon this work. Using this approach you can add depth to your animations and make the scenarios they depict seem more realistic.”

To make sure everyone was happy with the approach, Estefanía shared her preliminary sketches with the Global Forest Watch team at World Resources Institute. Although basic, these early designs prompted some great feedback that fed into the design of the moving parts. Getting feedback early on can save you lots of time in the long run, as adapting a sketch is easier than changing a multi-layer animation.

Representative.
Even though her animations are minimalist in style, Estefanía was still careful in her choice of what elements to feature in each one. Everything in the animation has to have a purpose. If it’s not essential to the story being told, it won’t be included. For example, clouds might make a drawing prettier but if they aren’t part of the narrative, you shouldn’t include them.
To help her decide what features to include and what kind of forest to draw, Estefanía talked to Ben and Enrique, two of our Scientists. They showed her pictures of rainforests, mangroves and plantations, and explained what happens when forests are cleared for agriculture or urban expansion. With this information, she could sketch out the dramatic changes that happen when deforestation occurs and add some little details that add character, like a tropical red flower or buttress roots.

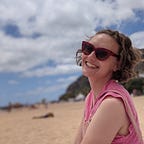
One of Estefanía’s favourite moments of the project was making a tree trunk fall into the river. People had told her that the animations reminded them of a video game, and since games are so engaging, she decided to build on this idea. Seeing the tree fall was the moment Estefanía realised she’d achieved her aim and found an engaging way to visualise forest loss.

As well as being representative of the real-life events that happen when forest loss occurs, the colours used in the animations reflect the Global Forest Watch brand. The greens match the brand’s colour palette and blend seamlessly with the overall appearance of the platform. It’s a subtle touch that goes a long way towards enforcing a brand and creating a more beautiful experience.
Performance.
Aesthetics shouldn’t interfere with good user interface, so animations are only good if people can view them without crashing their phones or sending their laptop fans into overdrive. To find the best approach, Estefanía paired up with Ed, one of our developers.
Animations can be placed on the screen in a variety of formats, he explained, but due to the complexity of the animations, and the number of moving images (nodes), using a video or a GIF would be very large. We also wanted to be able to transition smoothly between each animation for any given topic. This means we’d have to load all four animations at once. You’d end up requesting 100Mbs of image files for each topic, which is unrealistic if you want people to have a smooth experience that doesn’t crash.
So what is the solution? A popular method for animation is the use of Scalable Vector Graphics (SVGs) to dynamically draw on the screen. Instead of loading a heavy image you can draw the image instead. Using a plugin called BodyMovin for Adobe After Effects you can export the SVG to a JSON file which contains references for how to draw the animation. Best of all, if you are a designer you can do this step yourself and not rely on a developer to do it for you.
Ed then used a nice library from Airbnb called Lottie to take the JSON and render dynamic looped SVGs. Normally this method is used for simple animations, such as moving icons or logos, but in our case we sometimes had millions of complex nodes to move around with high levels of detail. Estefanía had to reduce the complexity of the animations so Lottie wouldn’t get jumpy. Another reason not to include clouds if they aren’t essential to the story.

The resulting JSON was 50kb and it’s tiny in comparison to a video. This allowed us to have a very light page with complete control over where we show the animations. You can check the code on our GitHub if you’re interested in doing something like this yourself.
It takes a team to make an animation.
Everything you see on your screen is the result of collaboration. Even this blog you are reading right now. Bringing together different skills and working together as one unified team will help you create the very best experiences for people who want to learn more about our world.
At Vizzuality, we add scientists to the mix of designers, researchers and developers to ensure data leads the design. If we can inspire people with our designs, and spark curiosity, we’re creating an opportunity that someone will use Global Forest Watch data to make decisions that are good for our planet.