Travel to the “Best Places in the Biosphere”.
New Guinea is the world’s second largest island. Its terrestrial biodiversity is generally recognised as both the richest and least explored in the world.
“Today, if I were offered another six decades of healthy life but told I must spend it in one place as a naturalist, I would take New Guinea. No contest,” said E.O. Wilson, acclaimed biologist

New Guinea is just one of E.O. Wilson’s “Best Places in the Biosphere,” 18 hand-picked places showcasing some of the most amazing, unique places in the world, as published in Wilson’s book, Half-Earth: Our Planet’s Fight for Life. These places are the personal choices of 18 experts in ecology and biodiversity invited by Wilson to “name one to five of the places in the world you consider best on the basis of richness, uniqueness, and most in need of research and protection.”
The “Best Places in the Biosphere” are a compelling starting point for anyone new to the concept of using biodiversity data to select which areas should be set aside for nature. While the list is somewhat subjective, as more data is gathered, analyzed and mapped, we begin to see significant overlaps with the predictions of these experts.

Created by an interdisciplinary team of scientists, designers and developers from the E.O. Wilson Biodiversity Foundation, Vizzuality, Map of Life, and Esri, the Half-Earth Project Map is mapping species data globally, and inspiring a deeper emotional connection with global biodiversity data and the conservation action it informs.
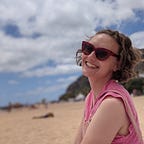
Presented on the beautiful, vibrant Half-Earth Project Map, each of the “Best Places in the Biosphere” is represented by a green dot that changes on hover to a preview photo, providing glimpses into each fascinating location, just the first of many small mapping design details that will spark interest and intrigue users.

You will already recognise some of the names on this list of “Best Places in the Biosphere”. Places like the Galapagos where finches evolved from a single ancestor to fill half a dozen bird niches.

And the Redwood Forests of California where groves of smaller trees, hidden from the ground can grow out of the soils that accumulate on the immense branches of the redwoods and sequoias that grow there.

Other places might be new to you. Like Socotra, a small, isolated island in the Indian Ocean. The trees grow there in such strange shapes that the place has earned itself a reputation as the “most alien-looking place on Earth.”

Or the Atewa Forests of Ghana, a remnant of pristine forest that’s at least ten and a half million years old.

The move from book to interactive data visualization brings the Half-Earth Project to a whole new audience, and encourages the user to explore the world of biodiversity more deeply. Each “Best Place” introductory card is the entry point to curated biodiversity data. Simply click ‘Explore this area’ to zoom in and take a closer look. At this point in the journey, you can learn more about the human pressures, conservation efforts, and species to watch in each area.

The 3D mapping capabilities of the technology built using the Esri stack allowed us to develop a frictionless experience for users. Through the ArcGIS JS API we are able to leverage the browsers native 3D capabilities, and the immersive experience this provides is a vital step in the journey that leads to an emotional connection with global data.
This guided introduction is an example of progressive disclosure, a design technique that’s often used to introduce people to increasingly complex information or interactions. Together, each of the organizations involved in the creation of Half-Earth Project Map is making it easier for people who are interested in biodiversity conservation and the Half-Earth Project to understand how priority places for biodiversity conservation are chosen.

As E.O. Wilson says, “Together we make the point that even though extinction rates are soaring, a great deal of biodiversity can be saved.”
Explore the maps today and join the movement to set aside half the Earth for nature.
This blog was also published on half-earth-project.org.