Practicing DatScyProcessing Audio data in JavaScriptProcessing Audio data in JavaScript can be challenging because of two factors:23h ago
Teng Wei HerrinLevel Up CodingAnimated Bar Chart with D3.js and ReactLearn the underlying concepts and how to plot charts with D3.js and ReactJan 283
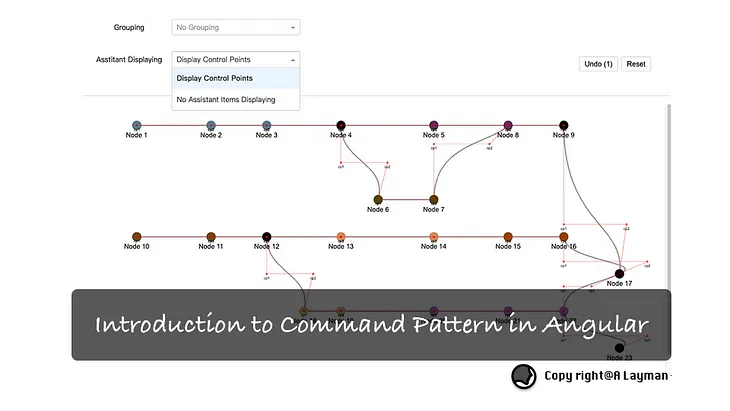
Jen-Hsuan Hsieh (Sean)inA LaymanIntroduction to Command Pattern in AngularThere are a few ways to delegate tasks. In this scenario, the display mode of path visualization will be changed when the option of…Jun 22Jun 22
StephenThe Best Libraries and Methods to Render Large Network Graphs on the WebWant to create a large network graph? Here are the technologies to do it with.3d ago3d ago
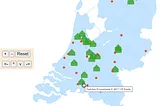
Lucas JellemaMap Visualization of (office locations in) The Netherlands -using GeoJSON, D3 and SVGThe combination of GeoJSON data sets and the JavaScript d3.js for SVG visualizations is quite valuable for creating rich and interactive…Jan 21Jan 21
Practicing DatScyProcessing Audio data in JavaScriptProcessing Audio data in JavaScript can be challenging because of two factors:23h ago
Teng Wei HerrinLevel Up CodingAnimated Bar Chart with D3.js and ReactLearn the underlying concepts and how to plot charts with D3.js and ReactJan 283
Jen-Hsuan Hsieh (Sean)inA LaymanIntroduction to Command Pattern in AngularThere are a few ways to delegate tasks. In this scenario, the display mode of path visualization will be changed when the option of…Jun 22
StephenThe Best Libraries and Methods to Render Large Network Graphs on the WebWant to create a large network graph? Here are the technologies to do it with.3d ago
Lucas JellemaMap Visualization of (office locations in) The Netherlands -using GeoJSON, D3 and SVGThe combination of GeoJSON data sets and the JavaScript d3.js for SVG visualizations is quite valuable for creating rich and interactive…Jan 21
Camelia D. Brumar🌮 Getting started with React + D3.jsTacos. Two fun facts that I like about tacos are that they can be filled with anything (really!) and that there is a day celebrating them…Jan 11, 20232
LEARN TO CODEHow to Create Interactive Data Visualizations with D3.jsData visualization is a critical aspect of data analysis, helping to convey complex data insights in an understandable and visually…5d ago
Erdogan TaskeseninTowards Data ScienceD3Blocks: The Python Library to Create Interactive and Standalone D3js Charts.Create interactive, and stand-alone charts that are built on the graphics of d3 javascript (d3js) but configurable with Python.Sep 22, 202212