SportsVizReflections on the course; Weapons of Math Destruction Pt. IIby E. NorthMay 27, 2021May 27, 2021
SportsVizBlog Post 6: Intermediate Implementation - continuedDear Data Visualization Family,May 6, 2021May 6, 2021
SportsVizBlog Post 5: First Intermediate ImplementationDear Data Visualization Family, Things are heating up! We are slowly but surely progressing into ideas that we sort of visualized in our…Apr 22, 2021Apr 22, 2021
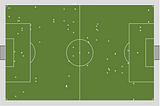
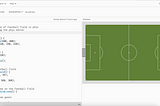
SportsVizVisualizing the football field (p5.js)To visualize the data, we make use of the p5.js language in javascript. One of the first visualizations we need to make is that of the…Apr 19, 2021Apr 19, 2021
SportsVizProviding feedback on each other’s blogsThe format of this feedback could be: “which 2 things to keep, which 2 things to change”. Also, if you have additional ideas for the other…Mar 31, 2021Mar 31, 2021
SportsVizLet’s be creative!The group started a small design session to get warmed up. Hey, we even tried to use Tableau to make one of our sketches somewhat…Mar 23, 2021Mar 23, 2021
SportsVizUnderstanding and checking the dataAfter preprocessing the data the group decided to check whether the data made sense. We decided to reconstruct the fourth goal by Kylian…Mar 20, 2021Mar 20, 2021
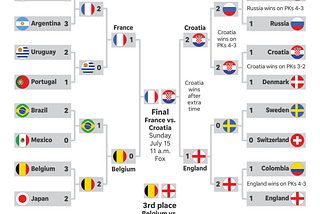
SportsVizVisualizing Men’s Football MatchesAuthors: Arabella D’Havé, Laura Knüppel, Elizabeth North, Pavel NovotnýMar 19, 2021Mar 19, 2021