A N NairEvolution of Public Key CryptographyThe problem of secure communication and digital contractsFeb 17, 2019Feb 17, 2019
A N NairA simple web application in python flaskFlask is a popular python package for developing web applications. Here we present a simple template to serve web applications using flask…Nov 12, 2017Nov 12, 2017
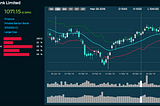
A N NairTrading dashboard using d3We have previously seen how to make a responsive candlestick chart using d3. The next step is to have multiple responsive charts arranged…Oct 31, 2017Oct 31, 2017
A N NairStock heat-map using d3Heat maps are a popular way of visualizing data in a matrix where the color / brightness of the various cells indicate the strength of a…Oct 28, 2017Oct 28, 2017
A N NairInput data wrangling in d3Very often we may need to process input data before visualizing it using d3. This is particularly true when we need to show charts over…Oct 25, 2017Oct 25, 2017
A N NairCandlestick chart using d3Candlestick charts are a style of financial charts which are useful in visualizing price movements in stocks, commodities or currencies. It…Oct 20, 20171Oct 20, 20171
A N NairTransitioning maps with d3When displaying maps using d3, we often need to transition the map between multiple selections. In some of our previous posts on cartograms…Oct 18, 20172Oct 18, 20172
A N NairTooltips in d3 SVGsIn some of our previous posts on cartograms and choropleth maps we were able to display dynamic tooltips using d3. D3 being a visualisation…Oct 16, 2017Oct 16, 2017
A N NairChoropleth map using d3Choropleth maps are thematic maps in which areas are shaded according to the strength of a particular feature. Its is a good visualisation…Oct 11, 20171Oct 11, 20171
A N NairGenerate a state level mapHere we attempt to generate a map of India showing all the states and the union territories.Oct 6, 2017Oct 6, 2017