Gerard DugganinLearning DataChoosing Visual Types with Context — Line ChartsIn data visualisation, we are often given advice at a high level on the types of visuals we should use according to the type of data…Feb 32Feb 32
Gerard DugganinLearning DataOverlapping and Target Charts in Power BI….using native visualsOct 21, 20233Oct 21, 20233
Gerard DugganinMicrosoft Power BICalculating CAGR in Power BIIf you have a series of business related measures over a number of years you may wish to calculate the CAGR, or Compound Annual Growth…Sep 30, 2023Sep 30, 2023
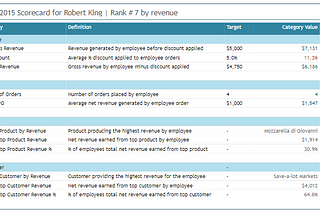
Gerard DugganinMicrosoft Power BIScorecard in Power BIHave you ever tried or wanted to create a table or scorecard in Power BI with a single column of values that may be a a mix of text and…Aug 22, 20231Aug 22, 20231
Gerard DugganinMicrosoft Power BIHacking a Donut or Stacked Bar in Power BI to make a KPI cardand some variations…Aug 4, 20232Aug 4, 20232
Gerard DugganinMicrosoft Power BIDynamic Colours to Highlight ValuesHow to apply dynamic colour formatting in Power BI column chartsJul 22, 20231Jul 22, 20231
Gerard DugganinMicrosoft Power BIColour Conditional Formatting with Parameters in Power BIA little housekeeping….Jul 13, 20233Jul 13, 20233
Gerard DugganinLearning DataA Data Journey Starting with DiscoveryHow I went from construction to a data role in arbitration, back to construction, and then finally landed a permanent role as a data lead.Jul 12, 20232Jul 12, 20232
Gerard DugganNorthwind Tutorial Model fileI am providing a copy of the model I am using for tutorials and walkthroughs I am giving on my YouTube channel and on my Medium posts.Jul 12, 2023Jul 12, 2023