
Mastering Dart & Flutter DevTools — Part 7: Memory View
by Ashita Prasad (LinkedIn, Twitter), fluttergems.dev
This is the seventh article in the “Mastering Dart & Flutter DevTools” series of in-depth articles. In this article, you will learn how to analyze the memory usage of Flutter apps using the DevTools’ Memory View tool. In case you want to check out any other article in this series, just click on the link provided below:
- Part 1: Introduction & Installation
- Part 2: Flutter Inspector
- Part 3: App Size Tool
- Part 4: Network View
- Part 5: Logging View
- Part 6: CPU Profiler View
- Part 7: Memory View [You are Here]
- Part 8: Performance View
Installation and setup of DevTools is a pre-requisite for this part. In case you missed it, the installation and setup details are provided in detail here.
Memory (RAM) is a limited resource that is shared by applications, kernel and OS processes running on a device. If an app uses too much memory:
- User experience gets compromised while using the app.
- A warning is sent to the user regarding high memory usage, exceeding which the app may crash or not respond.
- Performance of other apps running on the same device also gets impacted as it is a shared resource.
Your app can run more efficiently if it consumes less memory, thereby improving its performance and making it more responsive. This is especially important for apps that want to support a wider range of devices like IoT and older devices that have limited memory.
In this article, we will go through some fundamental concepts related to memory usage like garbage collection and memory leaks, and understand how DevTools’ Memory View can help us monitor the memory usage and identify any memory leaks.
Garbage Collection & Memory Leaks
Dart’s Garbage Collector helps us reclaim memory by removing objects that are no longer needed by the app. It looks for unreachable or unused objects in the heap that do not have any reference pointing at them, and clears these objects from the memory (heap).
So, there is no need to worry about memory usage of our App because we have Garbage Collector to clear it at regular intervals. Right?
Not exactly!
To understand it better let us look at the below Venn Diagram.

The above diagram shows the various types of objects present in the heap:
- The green circle represents the objects in the heap whose references still exist in the stack.
- The red circle represents the objects in the heap that are currently not being used. You might expect the GC to remove all of these unused objects, but thats not the case.
- GC only removes objects whose references no longer exist in the stack, that is represented as the non-intersecting portion of the red circle.
- There may still be some unused objects in the heap (intersection) that still have references in the stack. Failure to remove these objects from the memory is known as Memory Leak as these objects still occupy the memory even if they are not being used by the app.
Often more and more instances of these leaky objects are created while the older objects (whose references exist) still remain in the memory. This memory bloating often leads to:
- Poor App performance due to frame drops and lagging.
- App crashes due to Application Not Responding error or OutOfMemory error.
These issues may push a user into uninstalling the app. Thus, it is critical to ensure efficient memory usage (~100–150 MB range) by detecting and removing any such memory leaks.
In Dart & Flutter, the DevTools’ Memory View tool helps us analyze the heap snapshot of a Flutter app that can be used to identify and plug any detected memory leaks.
Memory View
Memory leak can be detected by analyzing the Heap Snapshot in the Memory View. These snapshots can be used to compare the growth of heap and detect objects that might experience unexpected increase in count. You must remember that although images and media have a high memory footprint they might not be the main cause of memory leaks.
Now, let us proceed and get started with the exercise.
Step 1: Getting the Source Code
Create a local copy of the below repository 👇
Open the repo in GitHub as shown below.

Click on the green button <> Code, then visit the Local tab and click Download ZIP to download the source code for this exercise.

Extract the file using any unzip tool.
We now have a local copy of the source in the folder flutter_mandel-master.
Step 2: Opening the Project in VS Code
Launch VS Code, open the project folder in VS Code and go to pubspec.yaml file.

Click on Get Packages to fetch all the packages required for the project.

Step 3: Launching Memory View in VS Code
To analyze the app’s memory footprint, it must be run on an actual device. So you can connect an iOS or Android device. In case it is a desktop app and the development desktop device is also the target platform, then the app can be compiled and run in profile mode on the desktop.
Click on No Device in the status bar and select the target device. If a default device is already selected, you can click on it and change the target device.

We will be building a macOS desktop app for our use case, so let us go ahead and select the target device as macOS. You can also choose Linux or Windows based on your OS.

Now, run the app (main function) in Profile mode as shown in the image below.

Click on Dart DevTools in the status bar and then click on the Open DevTools in Web Browser command.


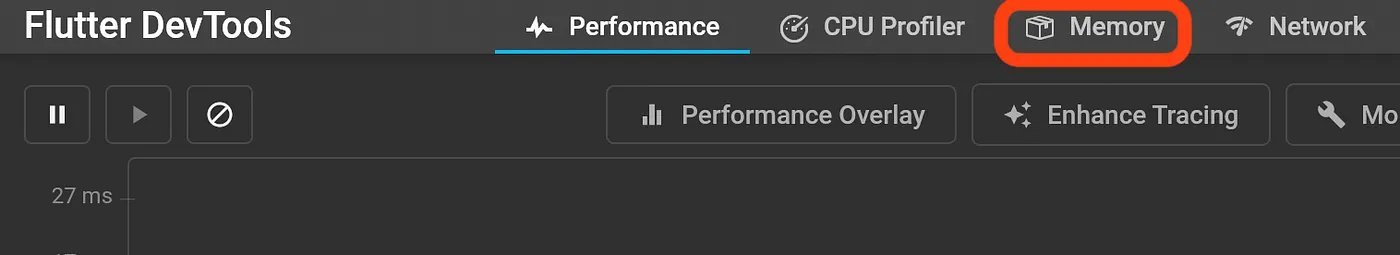
Now click on the Memory tab as shown below.
Once we click on the Memory tab, we can observe a dashboard as shown in the image below.

As shown in the image below, there are three primary buttons — Pause, Resume and Clear that can be used to pause Memory profiling, resume Memory profiling and to clear all Memory usage data, respectively.

By default, Memory View constantly collects the memory usage data as it can be seen in the Memory overview chart as shown below.

The length of the timeline can be changed by clicking on the Display Default option as shown below. We will not change it for the current use case.

Step 4: Taking the 1st Heap Snapshot Using Memory View
Let us take an initial snapshot of the heap after launching the app by clicking on the Take Heap Snapshot button in the Analysis tab as shown below. Also, if you take a look at the overview chart, a green circle appears in the timeline indicating that we took a manual snapshot.

If we go ahead and click on the Memory Overview Chart, the memory usage details at that particular instant is displayed as shown below.
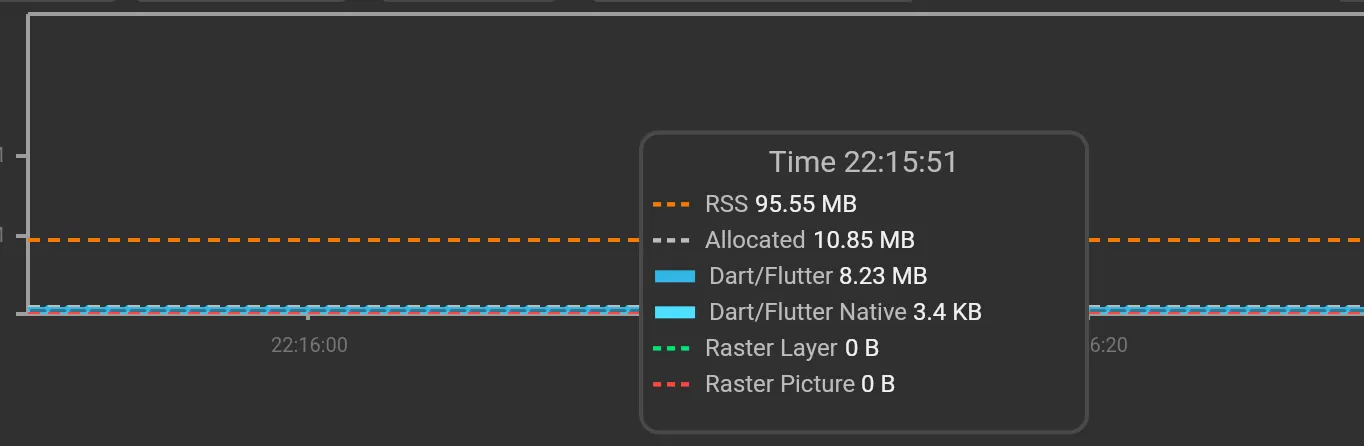
Various quantities that are displayed on the chart is as follows:
- RSS or Resident Set Size: The resident set size (RSS) is the portion of a program’s memory that is currently loaded into RAM and is available for immediate use. It can be thought of as the “working set” of a program, as it represents the memory that is actively being used to execute the program’s instructions. It includes all stack and heap memory along with the memory from loaded shared libraries.
- Allocated: Allocated memory refers to the portion of a computer’s memory that has been reserved for use by a specific program or process and is not available for use by other programs or processes. It is typically used to store the program’s instructions, data, and other necessary information. It is important to manage allocated memory carefully, as running out of allocated memory can cause a program to crash or otherwise malfunction.
- Dart/Flutter: Memory occupied by Dart and Flutter objects in the heap.
- Dart/Flutter Native: Memory occupied by the native objects exposed to the Dart VM by the native OS.
- Raster Layer: The size of the Flutter engine’s raster cache layer(s).
- Raster Picture: The size of the Flutter engine’s raster cache picture(s).
Step 5: Detecting Memory Leaks
To simulate a memory leak we will create 1 million instances of MemoryLeakObject on each button press and add it to the list leakObjects as demonstrated in the code below.
class MemoryLeakObject {
  final String text;

  MemoryLeakObject(this.text);
}

List<MemoryLeakObject> leakObjects = [];

class MemoryLeaksScreen extends StatelessWidget {
  const MemoryLeaksScreen({super.key});

  @override
  Widget build(BuildContext context) {
    return Scaffold(
      body: Center(
        child: ElevatedButton(
          child: const Text(
            'Add 1M Leaky Objects',
          ),
          onPressed: () {
            var i = 0;
            while (i < 1000000) {
              leakObjects.add(
                MemoryLeakObject('Id: ${leakObjects.length}'),
              );
              i++;
            }
          },
        ),
      ),
    );
  }
}
Let us now go ahead and press the Add 1M Leaky Objects button.

You can observe the increase in usage of memory after pressing the button as shown below.

Press Take Heap Snapshot to take a snapshot of the current heap. The count of the number of objects in the heap has now increased by ~1M as it can be seen in the Count column. On further traversing the snapshot, we can see that exactly 1M instances of MemoryLeakObject has been created and they occupy 15.3 MB memory.

By clicking on the Treemap switch, as shown below, you can view the memory footprint of all objects in the heap as a 2D hierarchical tree chart. This helps in detecting the objects occupying more memory along with their location in the source files.

Let us now click the button again and observe the increase in memory usage as shown below.

The details of memory usage can be seen below. The heap of Dart and Flutter objects now occupy 58.25 MB memory compared to 29.39 MB they occupied earlier. Also, the total allocated memory has increased from 44.38 MB to 67.38 MB.

Press Take Heap Snapshot to take a snapshot of the latest heap. The count of the number of objects in the heap has increased further by ~1M as it can be seen in the Count column. On further traversing the snapshot, we can see that exactly 1M new instances of MemoryLeakObject has been created (total 2M) and they occupy 30.5 MB memory.

Thus, using the Memory View, we were able to detect unused objects in the memory heap that were the cause of the memory leak. If we continue pressing the button, then the heap size will keep on increasing until the total allocated memory required is more than the available device memory and the app will crash.
In this article, we learnt the cause of Memory Leaks and how we can detect them using the DevTools’ Memory View tool. In the example application, we triggered the creation of new leaky objects and then analyzed the heap snapshot using the Memory View. This helped us in detecting the source of the memory leaks which can now be fixed to improve the app’s user experience.
We would love to hear your experience with the DevTools’ Memory View. In case you faced any issues while going through this exercise or while running the tool for your project, please feel free to mention it in the comments and we can definitely take a look into it. Also, in case you have any other suggestion, do add it in the comments.
In the remaining articles of this series, we have discussed other tools available in the DevTools suite that can help you build high-performance Flutter apps. Don’t forget to check out the links below to navigate to the tool you want to learn next:
- Part 1: Introduction & Installation
- Part 2: Flutter Inspector
- Part 3: App Size Tool
- Part 4: Network View
- Part 5: Logging View
- Part 6: CPU Profiler View
- Part 8: Performance View
Source Code(s) used in this article:
Special thanks to Kamal Shree (GDE — Dart & Flutter) for reviewing this article.