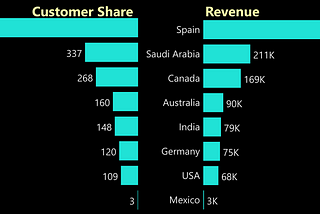
Chinemerem OjinkeyaUtilizing Customer Segmentation in Creating Targeted Marketing Campaigns Using Python and Power BIUsing Customer Segmentation to improve marketing impactOct 9, 2022Oct 9, 2022
Chinemerem OjinkeyaMaven Space ChallengeCreating a single-page data visualization that captures the awe of outer space through our history with space travel with Power BIOct 1, 2022Oct 1, 2022
Chinemerem OjinkeyaSales Analysis with Power BICreating a Sales Dashboard with Power BISep 29, 2022Sep 29, 2022
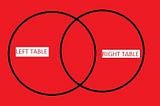
Chinemerem OjinkeyaA Beginners Guide to SQL JoinsAn efficient way to properly understand the basics of SQL joins is to illustrate its similarities to set theory by using Venn Diagrams.Sep 13, 2021Sep 13, 2021
Chinemerem OjinkeyaA Statistical Declaration of the Need to be Loved.“Have you ever liked anyone?”Aug 17, 2021Aug 17, 2021
Chinemerem OjinkeyaEpiphanyDuring the run of the data analysis course at Gitgirl School Of Data I learnt so much. I’ll share that with you but it will be paraphrased…Jul 1, 20191Jul 1, 20191
Chinemerem OjinkeyaMo Chart Mo ProblemsThe title is actually ironic. Charts are very helpful in visualization of and understanding data. They’re just so much of them.May 25, 2019May 25, 2019
Chinemerem OjinkeyaTHE TITANIC!!!We all know the story. At least the love story the movie fed us. Not all is fiction though. There might not have been a Jack or a Rose but…May 10, 2019May 10, 2019
Chinemerem OjinkeyaThe FizzBuzz ProblemThursdays are my favorite days since starting the data analysis program on git-girl. We always have this little session called…Mar 27, 2019Mar 27, 2019
Chinemerem OjinkeyaWhat I wished I had known before submitting my first report in my data analysis program.The first day I joined the data analysis program being run by Git-girl, Lagos, there was a project whose deadline was that day. That is my…Mar 26, 2019Mar 26, 2019