Uber Movement TeaminUber MovementImproving Road Safety in Cincinnati’s Northside neighborhoodA Movement Speeds Case Study3 min read·May 14, 2019--1--1
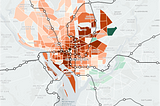
Uber Movement Teaminvis.glUsing Kepler.gl and Movement to Visualize Traffic Effects of a RainstormOn January 12th, 2018, the Pittsburgh area experienced major flooding due to a severe rainstorm. Major roads and freeways were flooded as…3 min read·May 29, 2018----
Uber Movement TeaminUber MovementExamining the Impact of Traffic as Delhi Shops on DhanterasUsing Uber Movement data to measure travel times during Dhanteras in New Delhi3 min read·May 29, 2018----
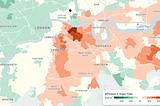
Uber Movement TeaminUber MovementHow March Floods Affected Nairobi Travel TimesUsing Uber Movement to measure the impact of March 2018 flooding on travel times throughout Nairobi.3 min read·Apr 11, 2018----
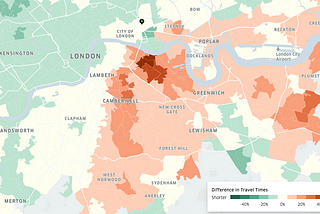
Uber Movement TeaminUber MovementExamining the Impact of the London Tower Bridge ClosureThis post is the second in a series using Uber Movement to measure the impact of critical urban infrastructure closures.3 min read·Mar 15, 2018----
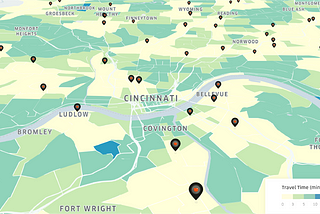
Uber Movement TeaminUber MovementVisualizing Access to Healthy Food Options in CincinnatiUsing data from Uber Movement to look at access to healthy food options5 min read·Jan 30, 2018----
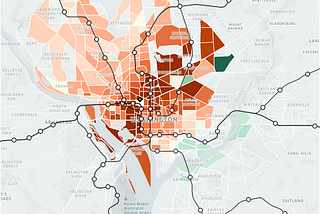
Uber Movement TeaminUber MovementThe effects of DC Metrorail service disruptions on traffic congestionUsing Uber Movement to examine service disruptions of the DC Metrorail4 min read·Jan 5, 2017----
Uber Movement TeaminUber MovementAnalyzing Trends In 2015 Holiday Travel Conditions5 min read·Nov 16, 2016----
Uber Movement TeaminUber MovementHelping build the IPA Transport Metric to See How Cities Move1 min read·Oct 1, 2016----