Homepage
Open in app
Sign in
Get started
About Us
Generative AI
Machine Learning
Deep Learning
Data Visualisation
GenAI Course
Tagged in
Visual Design
Analytics Vidhya
Analytics Vidhya is a community of Generative AI and Data Science professionals. We are building the next-gen data science ecosystem
https://www.analyticsvidhya.com
More information
Followers
66K
Elsewhere
More, on Medium
Visual Design
Weronika Gawarska-Tywonek
in
Analytics Vidhya
May 3, 2021
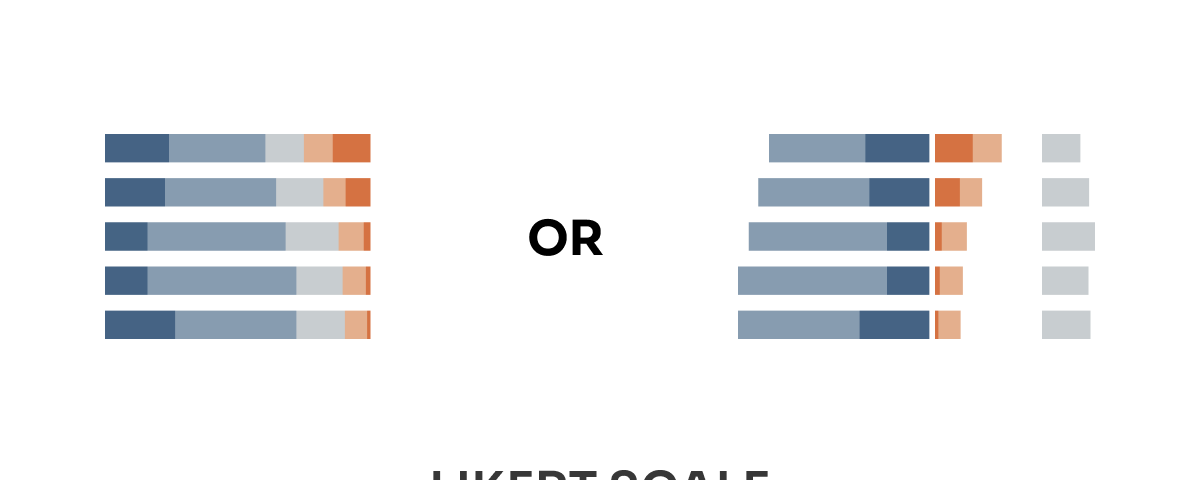
More user-friendly alternative for the stacked bar chart.
Incremental Improvements #04: Likert Scale
Read more…
11
1 response
Weronika Gawarska-Tywonek
in
Analytics Vidhya
Apr 26, 2021
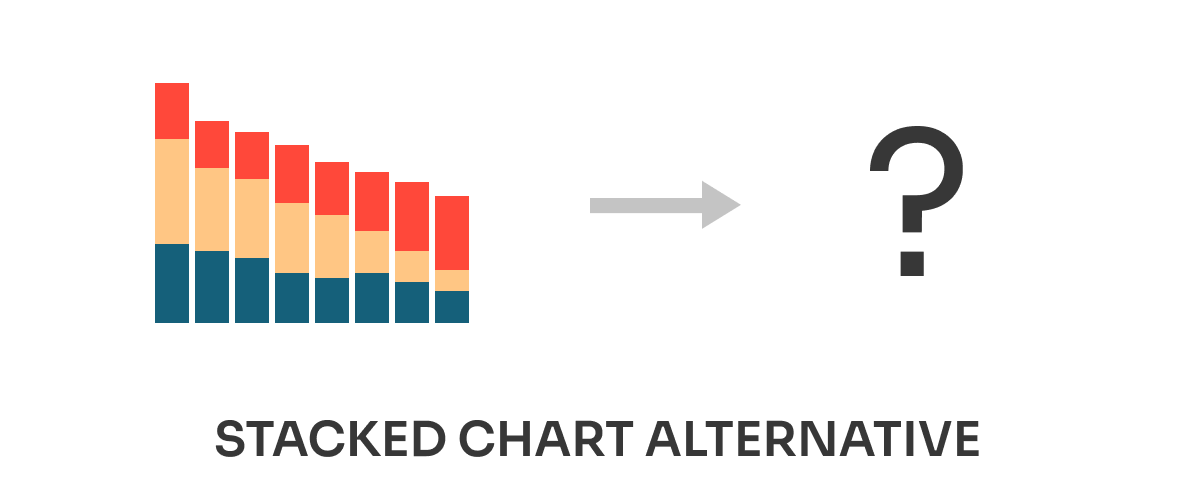
Eurostat: Tourism participation in EU
Incremental Improvements #03: Stacked Bar Chart alternative
Read more…
5
Weronika Gawarska-Tywonek
in
Analytics Vidhya
Apr 19, 2021
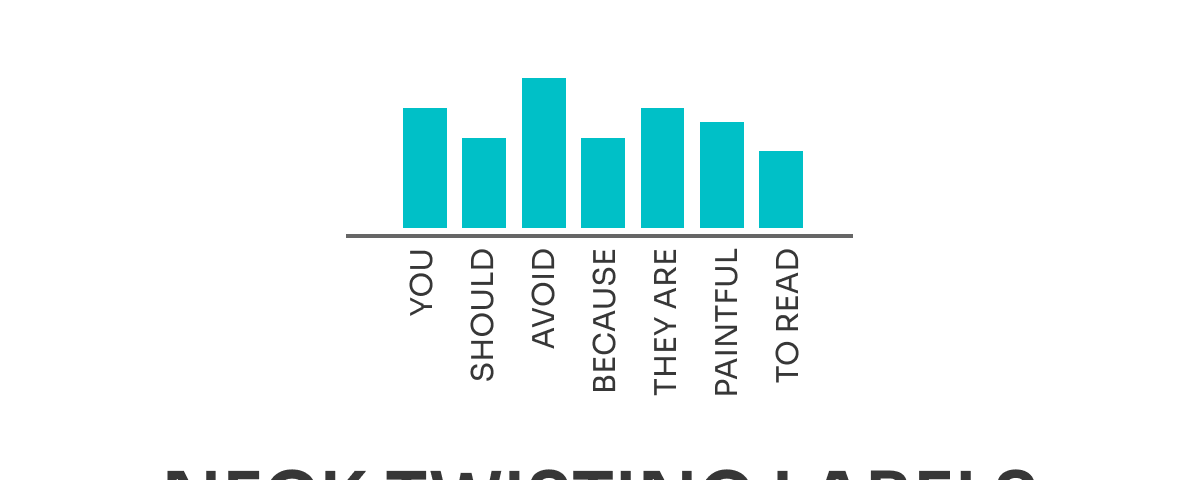
The Neck Twisting chart
Incremental Improvements #02: Bar chart usage
Read more…
76
Weronika Gawarska-Tywonek
in
Analytics Vidhya
Mar 29, 2021
Path dependence by The Economist
Incremental Improvements #01: Small multiples
Read more…
228
2 responses
Andre Ye
in
Analytics Vidhya
Mar 26, 2020
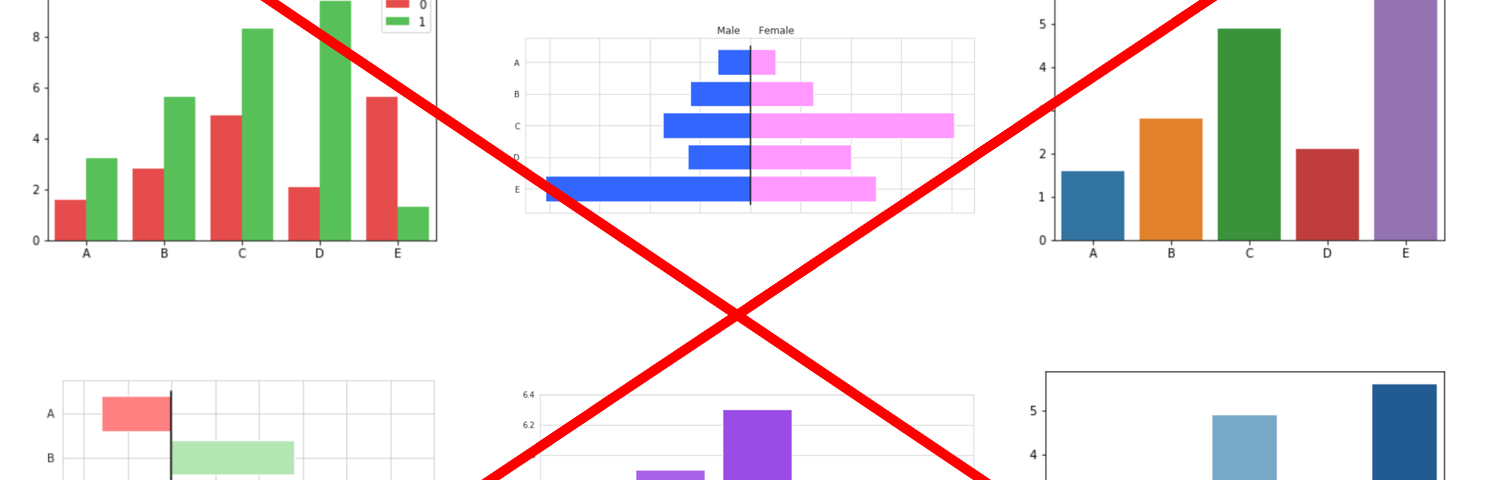
Tips to stop doing bar charts wrong
Communicate your data more effectively
Read more…
1K
5 responses
Chi Nguyen Thuy
in
Analytics Vidhya
Mar 15, 2020
Make the your Bar chart interesting!
When it comes to how to visualize the number that presents the…
Read more…
52