Homepage
Open in app
Sign in
Get started
Open Source
Deep Learning
Data Science
Trusted AI
CODAIT
Tagged in
Data Visualization
Center for Open Source Data and AI Technologies
Things we made with data at IBM’s Center for Open Source Data and AI Technologies.
More information
Followers
2.5K
Elsewhere
More, on Medium
Data Visualization
Christian Johnson
in
Center for Open Source Data and AI Technologies
Aug 23, 2017
Move over, MatPlotLib
Visualization made easy with faith, trust, and PixieDust
Read more…
29
Jordan George
in
Center for Open Source Data and AI Technologies
Aug 14, 2017
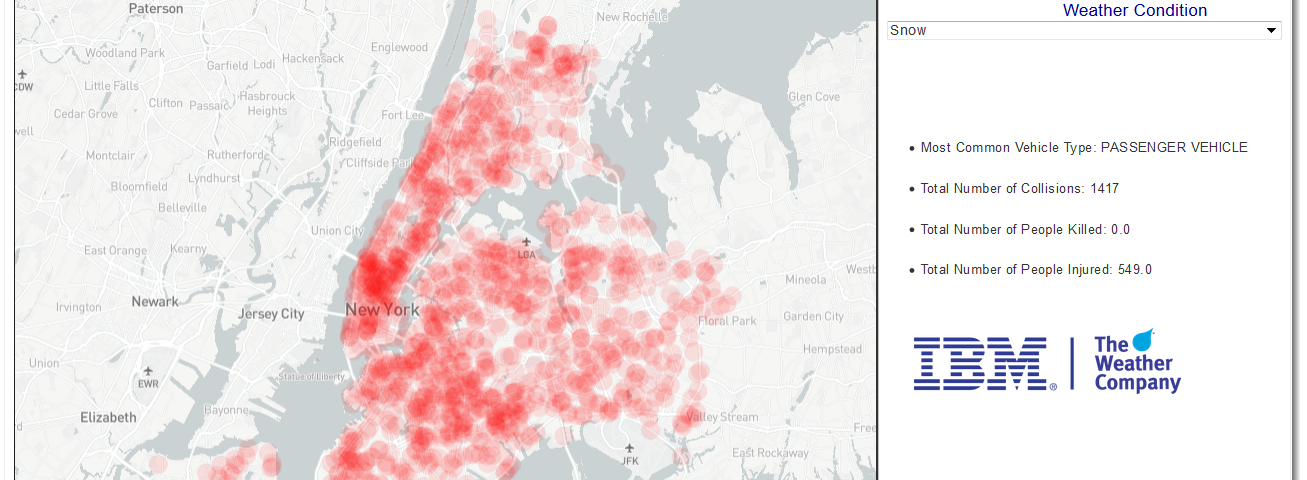
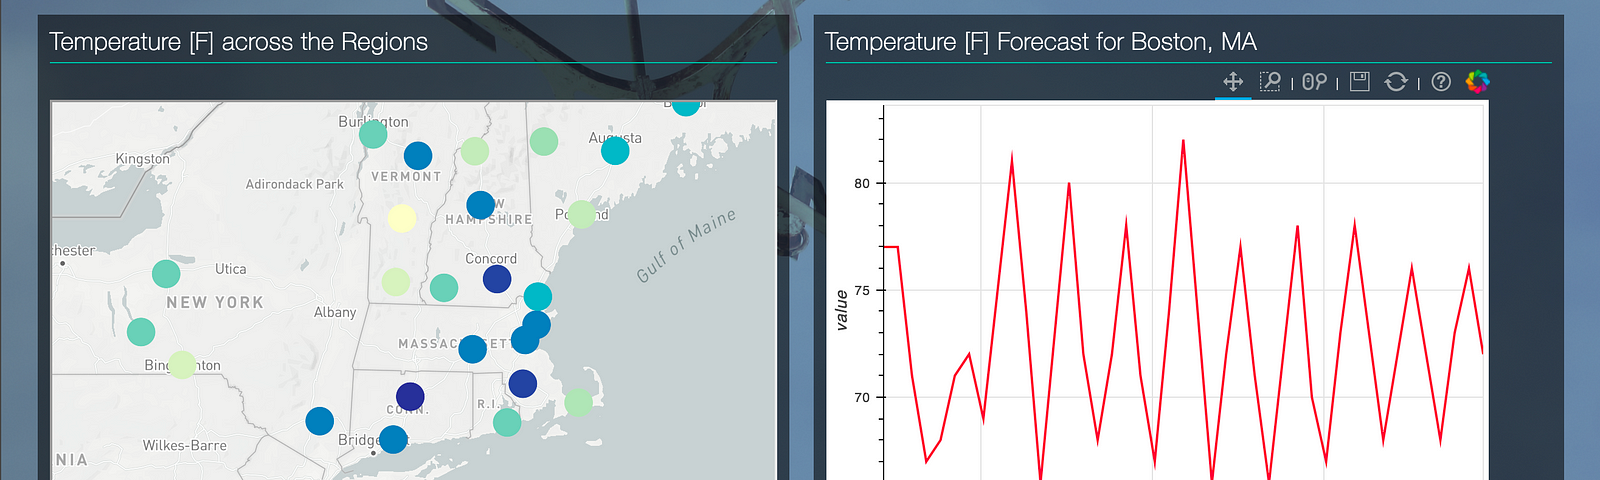
Visualizing Weather Data as a PixieApp
How I used MapBox and The Weather Company data to create a…
Read more…
27
Mike Broberg
in
Center for Open Source Data and AI Technologies
May 9, 2017
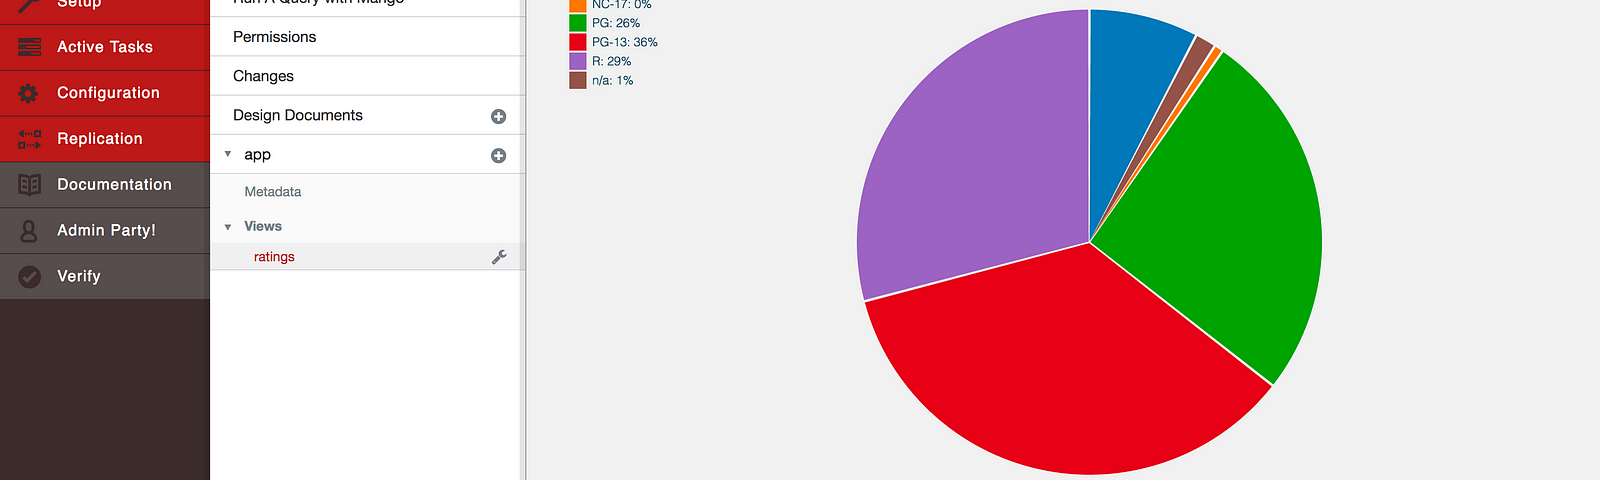
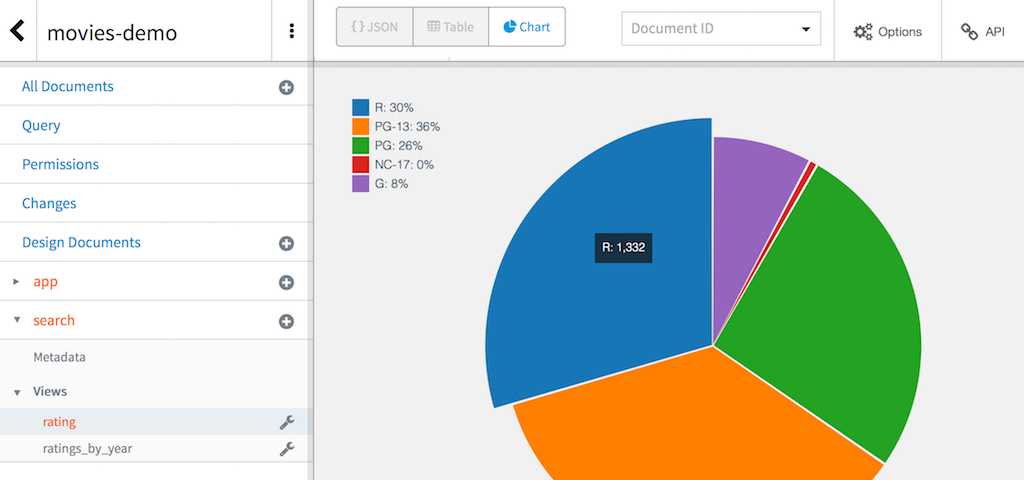
Simple Data Visualization in Apache CouchDB™
D3, right in the Fauxton dashboard, via userscript
Read more…
47
//va
in
Center for Open Source Data and AI Technologies
May 1, 2017
Share the (PixieDust) Magic
Packaging and distributing your PixieDust plugin as a Python module on…
Read more…
13
//va
in
Center for Open Source Data and AI Technologies
Apr 26, 2017
You Too Can Make Magic (in Jupyter Notebooks with PixieDust)
Getting started with custom…
Read more…
23
3 responses
David Taieb
in
Center for Open Source Data and AI Technologies
Apr 13, 2017
PixieDust gets its first community-driven feature in 1.0.4
Now with time series data, the fairy tale…
Read more…
20
//va
in
Center for Open Source Data and AI Technologies
Apr 7, 2017
Eye Candy for Cloudant
Data visualization right in the dashboard, via userscript
Read more…
61