Create a basic pie chart
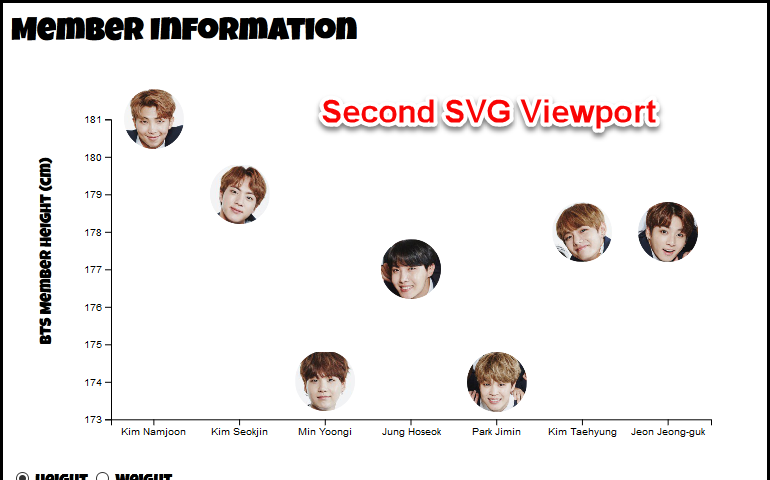
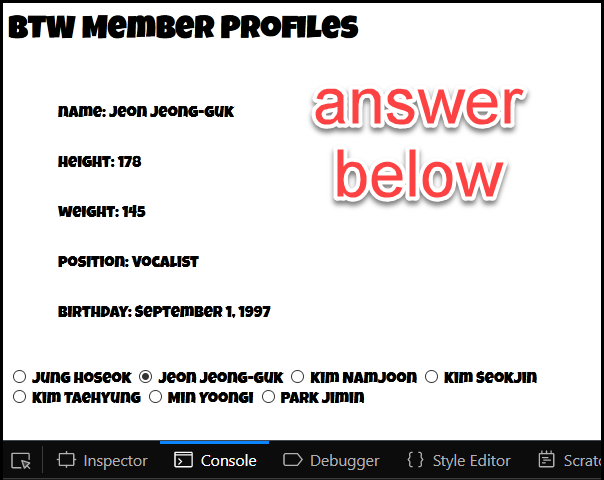
Set up structure to plot data on all 7 BTS band members
US Rainfall Part 9 — Plotting circle position based on data set
US Rainfall Part 8 — d3.scaleLinear, d3.extent for min and max
US Rainfall Part 7 — plot x coordinate using d3.scaleBand
US Rainfall Part 6 — set up scales and axis
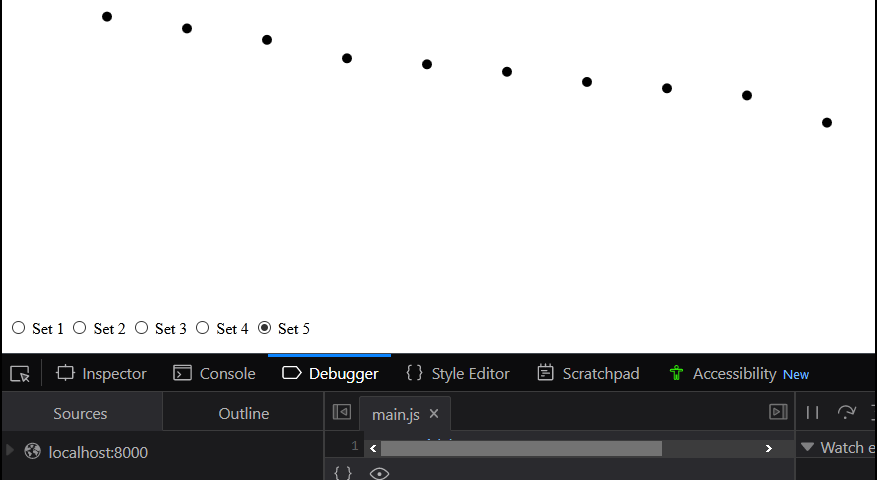
US Rainfall Part 5— Updating data
US Rainfall Part 4 — setting up SVG viewport with margins