Homepage
Open in app
Sign in
Get started
Contribute
Tech
Programming
Data Science
Software Development
Cybersecurity
Newsletter
Tagged in
Data Visualization
CodeX
Everything connected with Tech & Code. Follow to join our 1M+ monthly readers
More information
Followers
22K
Elsewhere
More, on Medium
Data Visualization
Gabe Araujo, M.Sc.
in
CodeX
Aug 29
How I Automated My Life: 101 Practical Python Scripts for Everyday Tasks
Read more…
45
2 responses
Pierre DeBois
in
CodeX
Aug 7
What’s New in The GT Library Version 0.11 That Makes R Programming Data Tables Easier To Create
The latest version of the gt library for R programming offers LaTeX styling, chemical notation, and new…
Read more…
15
Dr. Alvin Ang
in
CodeX
Jul 23
Activity for Correlation Heatmap: Quakes Dataset
Part 7b of Plotting with R by Dr. Alvin Ang
Read more…
Dr. Alvin Ang
in
CodeX
Jun 11
How to Approach Different Audiences when Doing Data Visualisation
Part 0b of Learning Tableau by Dr…
Read more…
Dr. Alvin Ang
in
CodeX
Jun 10
Do You Really Need a Dashboard? Or a Chart? Or None at All?
Part 0a of Learning Tableau by Dr. Alvin…
Read more…
4
Paula LC
in
CodeX
Jul 3
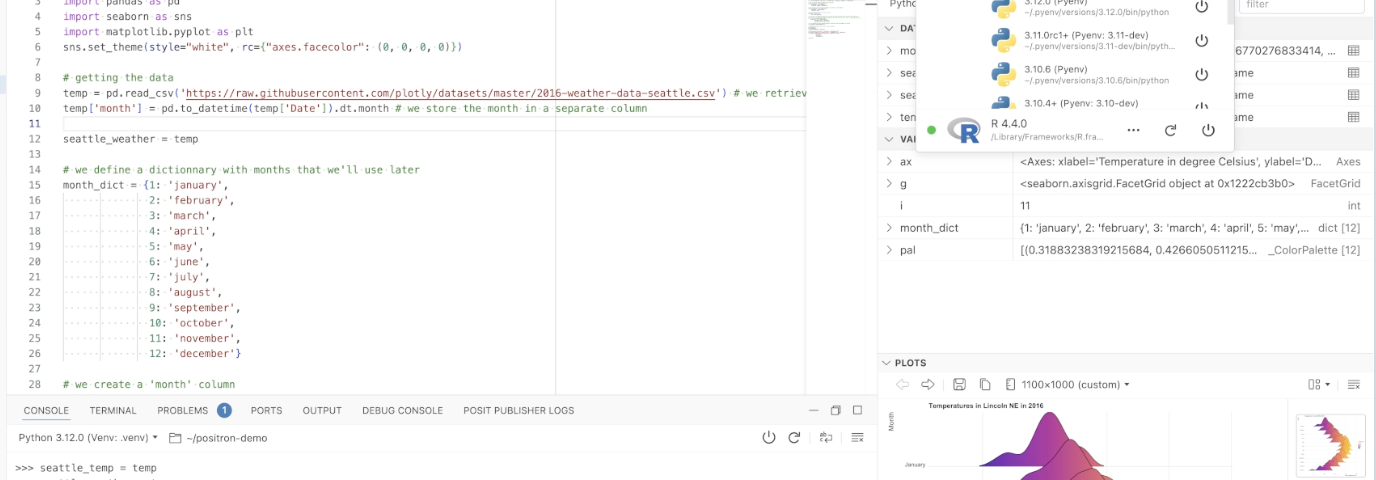
Positron: The new IDE for Data Science
In this post, I would like to talk about the
new IDE for Data Science
created by the company…
Read more…
410
2 responses
Everton Gomede, PhD
in
CodeX
Jun 13
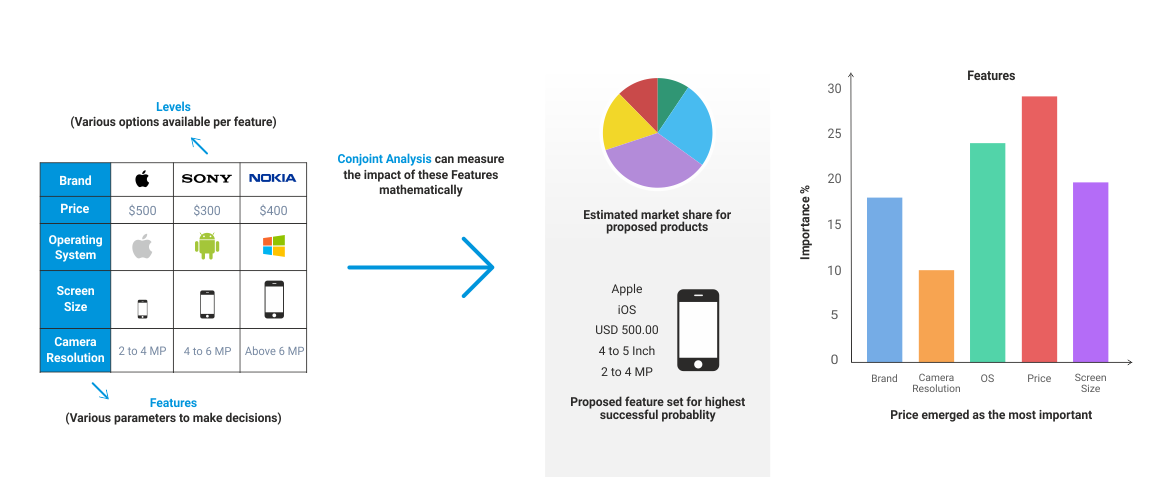
Unlocking Consumer Preferences: The Power of Conjoint Analysis
Abstract
Read more…
1
Gerardo Perrucci
in
CodeX
Jun 2
Machine Learning Visualization Missing Values
Visualizing Missing Data: A Step-by-Step Guide
Read more…
41
Everton Gomede, PhD
in
CodeX
May 23
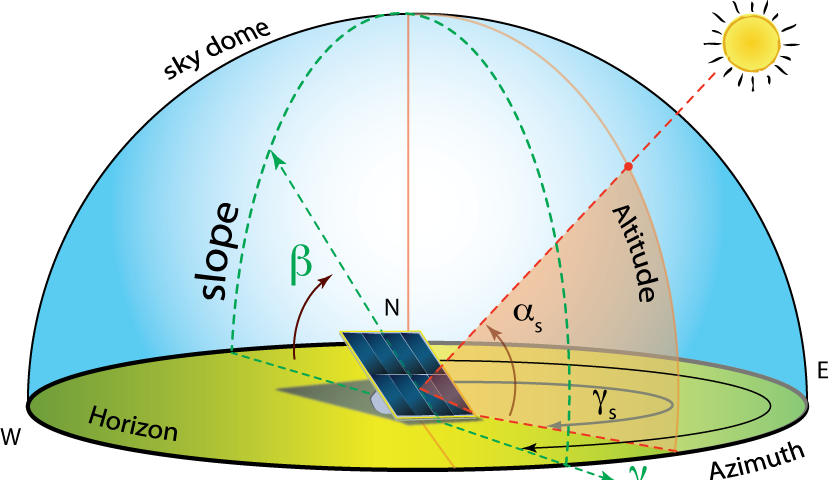
Harnessing the Sky: Understanding Zenith and Azimuth Impacts on Wildfire Dynamics
Abstract
Read more…
1
Mochamad Kautzar Ichramsyah
in
CodeX
May 25
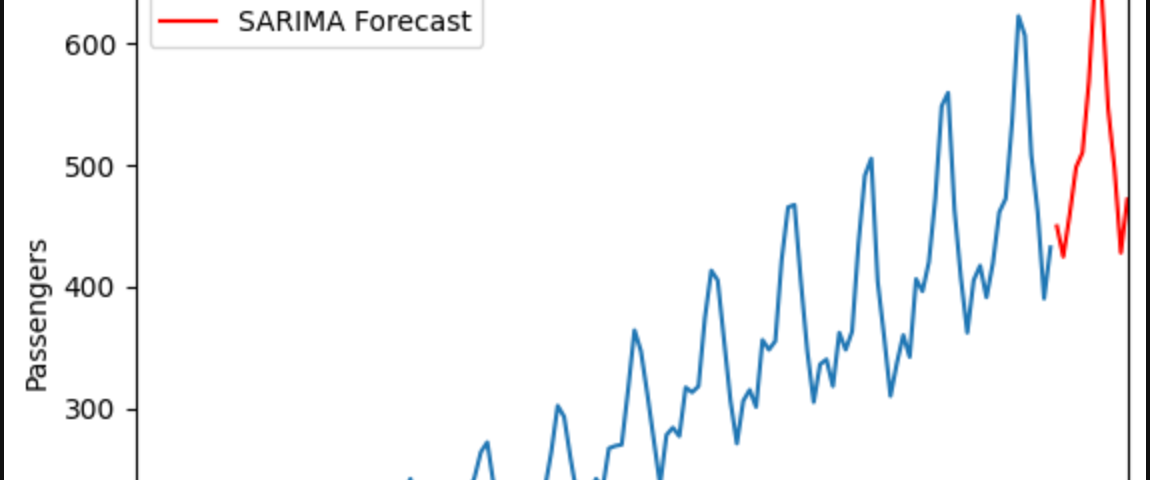
Classical time-series forecasting methods in Python and R for beginners
Read more…
43
1 response