Homepage
Open in app
Sign in
Get started
Azure
Power BI
Databricks
Fabric
Archive
Company
Tagged in
Data Visualization
Creative Data
Improving social good by the power of data and analytics.
More information
Followers
18
Elsewhere
More, on Medium
Data Visualization
Patrick Pichler
in
Creative Data
Aug 12, 2021
Comparing Selected Categories in Power BI
How to compare multiple selected categories in Power BI…
Read more…
12
3 responses
Patrick Pichler
in
Creative Data
Nov 9, 2020
Custom Time Intelligence Tricks in Power BI
Two Custom Time Intelligence Tricks to Improve the…
Read more…
108
Patrick Pichler
in
Creative Data
May 3, 2020
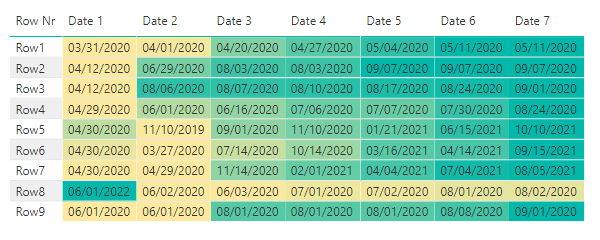
Power BI Conditional Formatting by Rows
Recreating Excel table in Power BI having applied conditional…
Read more…
66
1 response
Patrick Pichler
in
Creative Data
Jul 22, 2020
Visualization Libraries in the Age of Advanced Self-Service BI Tools
Why learning and relying on…
Read more…
22