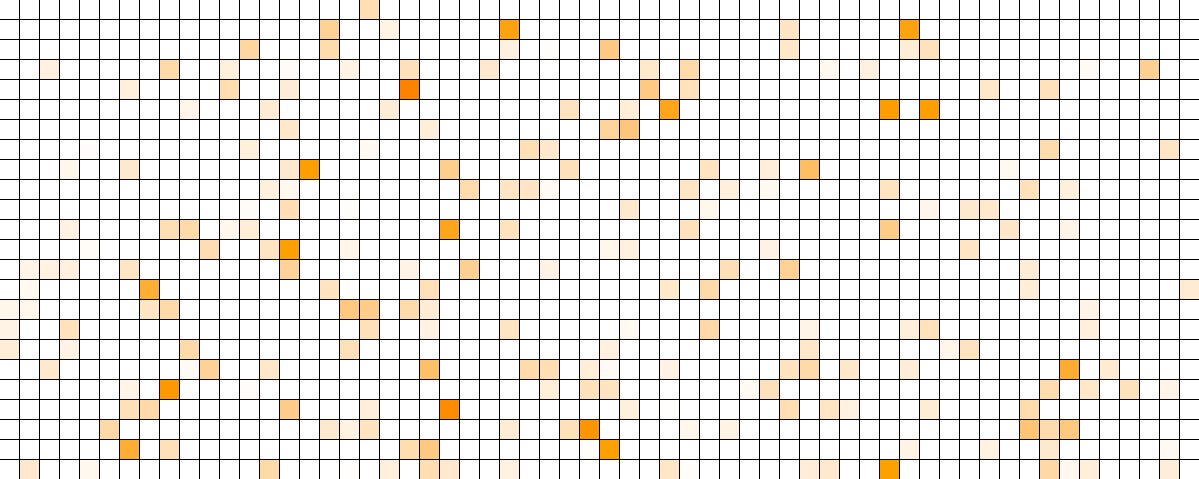
This interface visualizes the earthquake data over the past year.
import csvdef…
def setup():
    size(3100,1000)
    import csv
    #file_path = "W:\Fall 2017\DataMining"
    with open("/W:/Fall 2017/DataMining/quakes.csv") as f:
        reader=csv.reader(f)
        header=reader.next()


        global magnitudes
        magnitudes = []

        for row…
Each cell represents one minute — the 60 columns, the 60 minutes in an hour and the 24 rows, the 24 hours in a…