Tagged in
Infographics
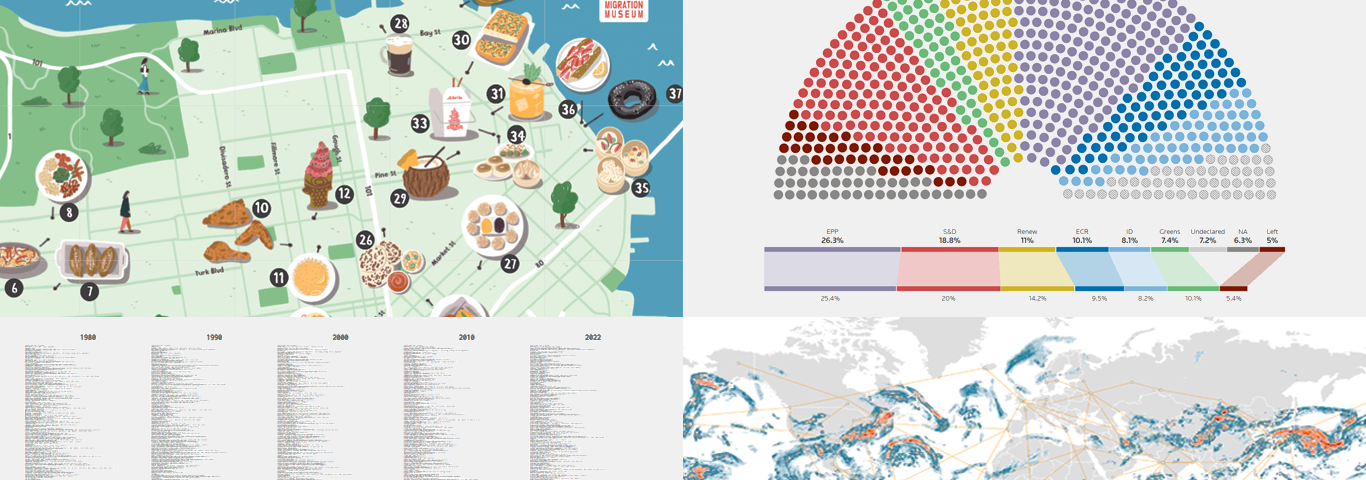
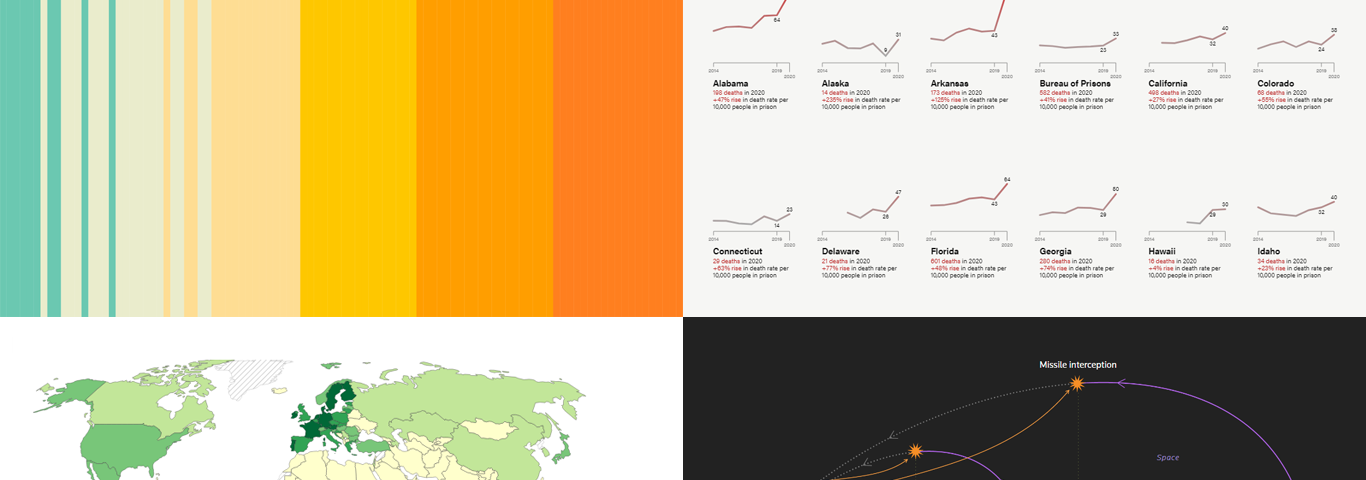
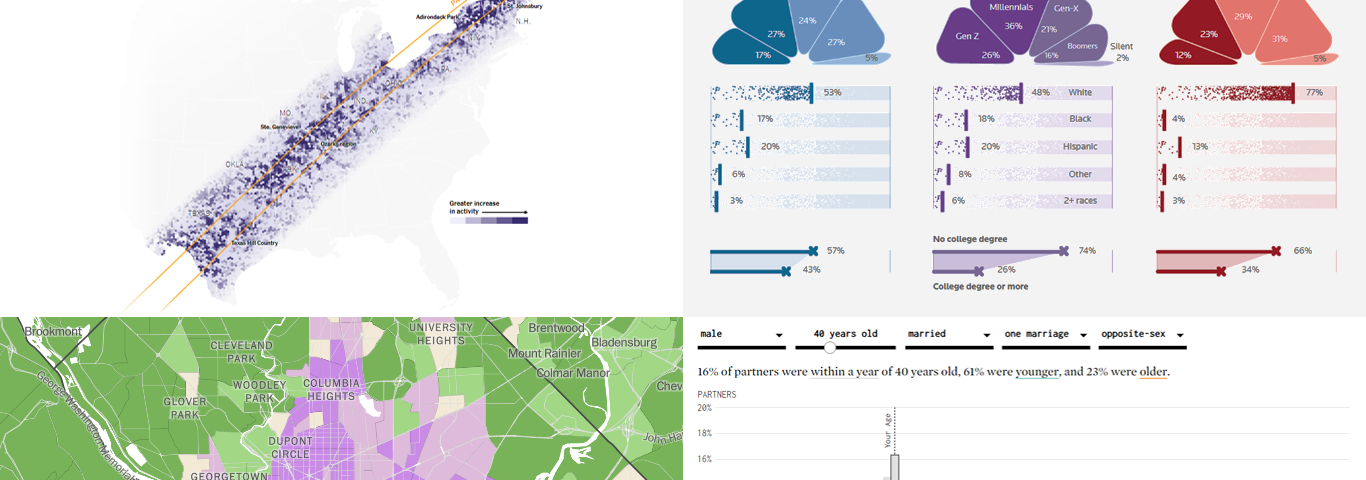
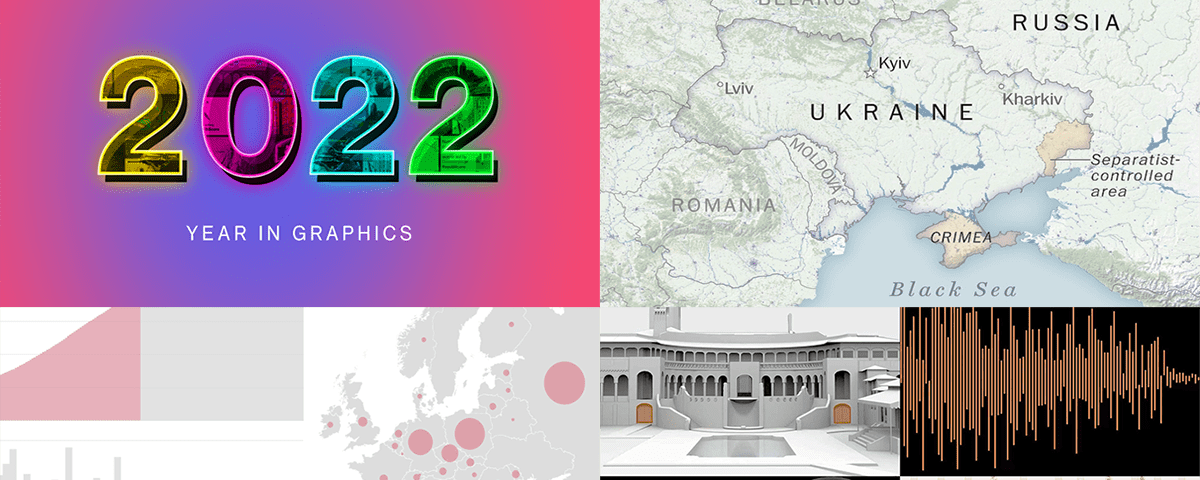
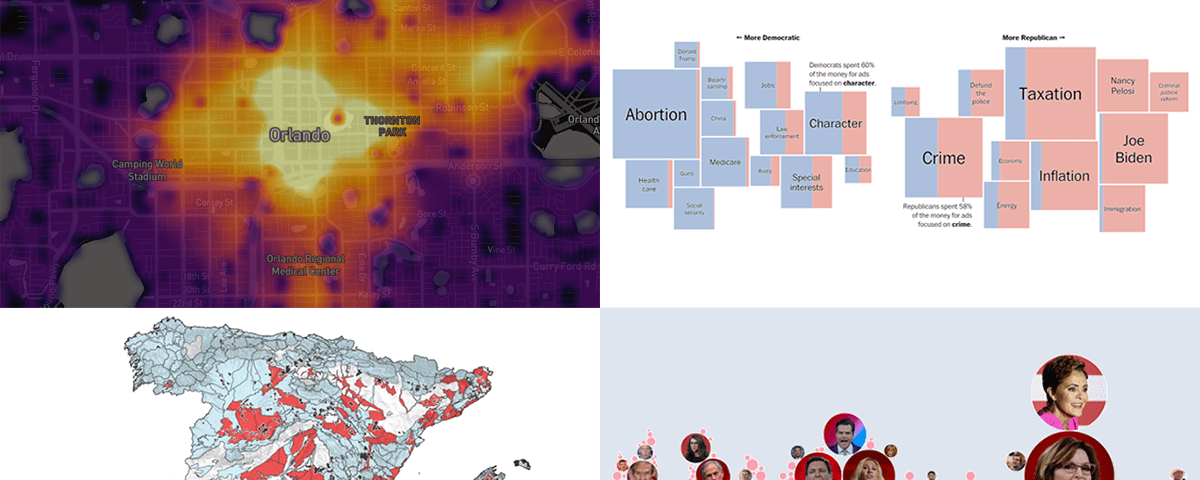
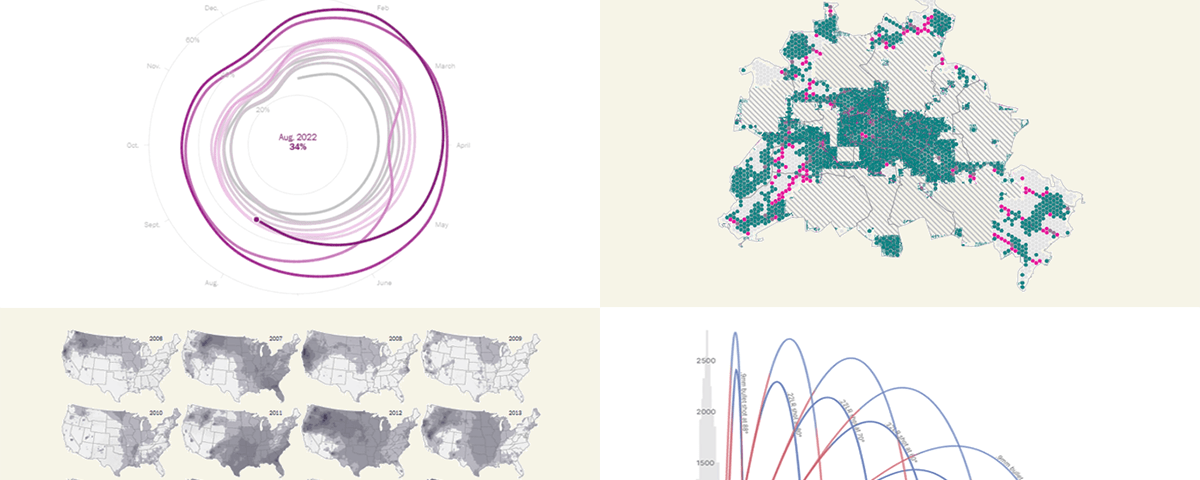
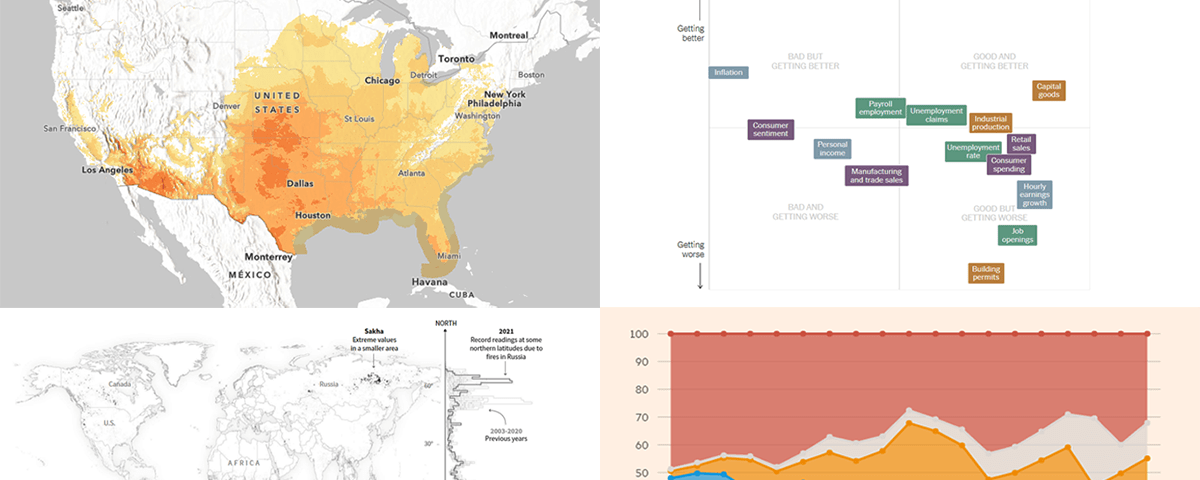
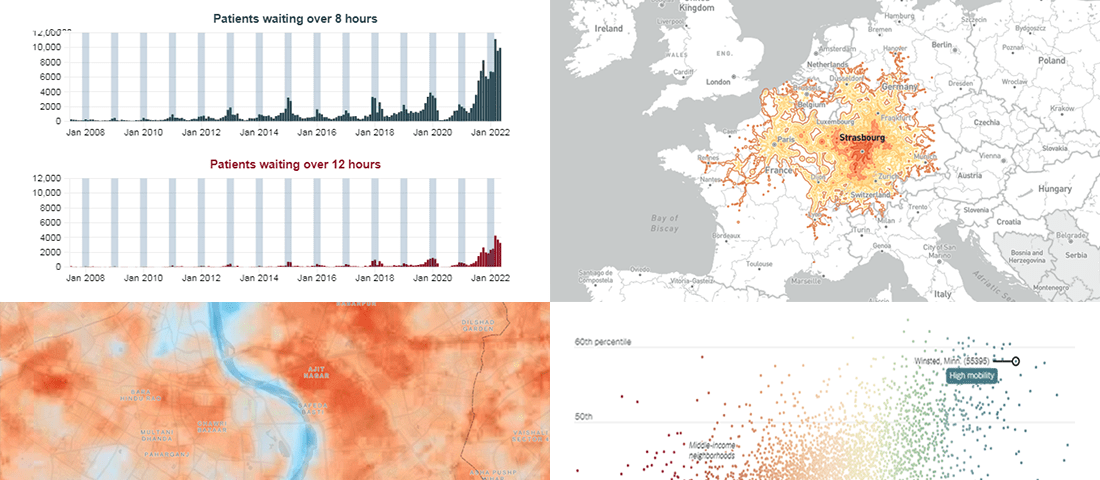
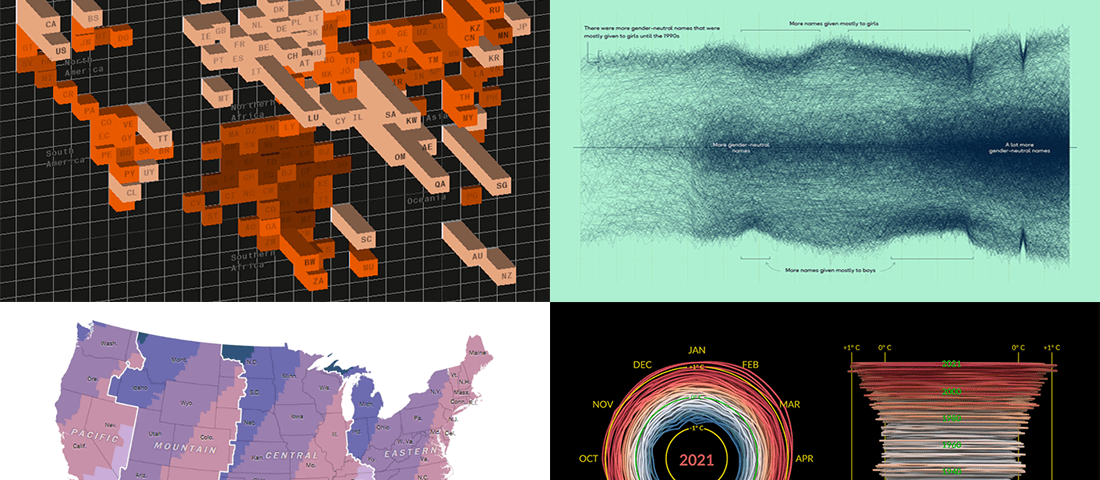
Data Visualization Weekly
Putting a spotlight on some of the most interesting new charts, maps and infographics as great examples showing the power of data visualization in action, curated from around the web every week. Made or found a cool data viz? Let us know for a chance to get featured.
More informationFollowers
More, on Medium