Homepage
Open in app
Sign in
Get started
ROUNDTABLES INSIGHTS
TOPIC DEEP DIVES
ABOUT
POWERED BY OPENOCEAN VC
Tagged in
Data Visualization
DataSeries
Imagine the future of data
More information
Followers
8.3K
Elsewhere
More, on Medium
Data Visualization
Tricia Aanderud
in
DataSeries
May 11, 2015
How Not Knowing Pie Charts Makes You a #DataViz Rookie
Why do Beginners Think Pie Charts are Useful?
Read more…
Soumendra Mishra
in
DataSeries
Jul 28, 2020
Unifying Enterprise Log Analysis
360-degree view of enterprise logs and point-in-time root cause…
Read more…
22
Eugenia Anello
in
DataSeries
Aug 26, 2021
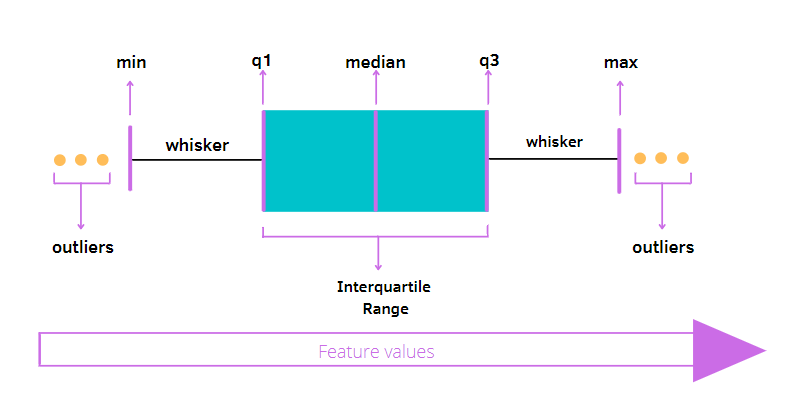
An intuitive introduction to Boxplots
A
graphical display
to better understand and interpret your dataset
Read more…
124
2 responses
Tricia Aanderud
in
DataSeries
May 24, 2021
Data Storytelling: Effective and Not so Effective Examples
Read more…
97
osint discovery
in
DataSeries
Jan 30, 2021
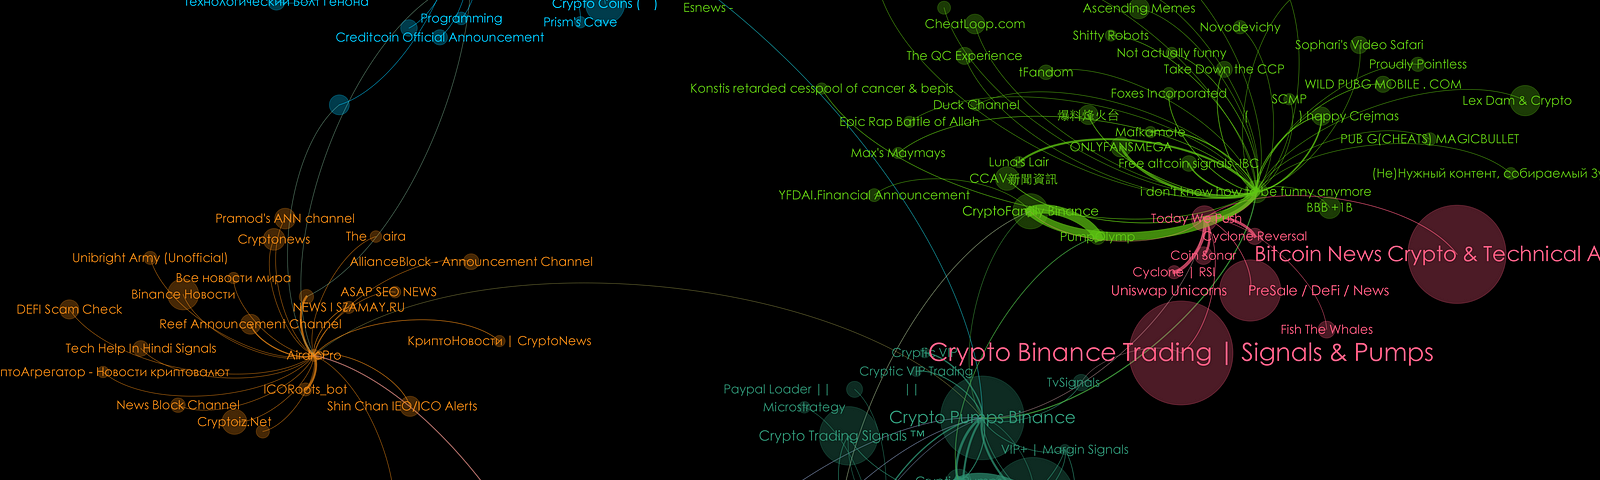
Telegram Network Visualization — Tracing Forwards and Mentions
Visualize the flow of information…
Read more…
68
2 responses
Lawrence Alaso Krukrubo
in
DataSeries
Nov 19, 2020
Analyzing GADS 2020 Phase-One
EDA on Google Africa Developer Scholarship phase-one 2020…
Read more…
100
Alasdair Moore — CEO@Idataquality
in
DataSeries
Aug 18, 2020
Getting Started With Data Quality
Your complete guide to DQ
Read more…
116
Lawrence Alaso Krukrubo
in
DataSeries
Jul 26, 2020
Mastering Matplotlib: Part 4
Starting EDA with impactful Visualizations…
Read more…
58
Valeria Nesterovich
in
DataSeries
Jul 8, 2020
Business Intelligence or How to Make Your Data Work for You
Read more…
7
Valeria Nesterovich
in
DataSeries
Jun 17, 2020
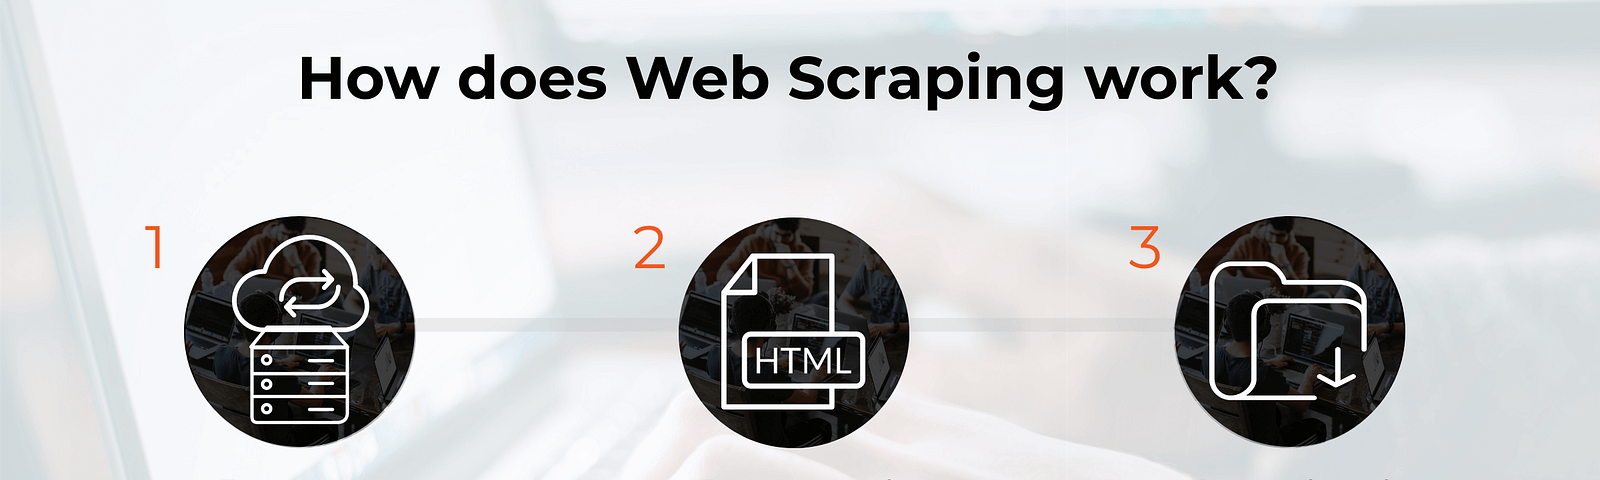
The Complete Beginner’s Guide to Web Scraping
Read more…
8