About
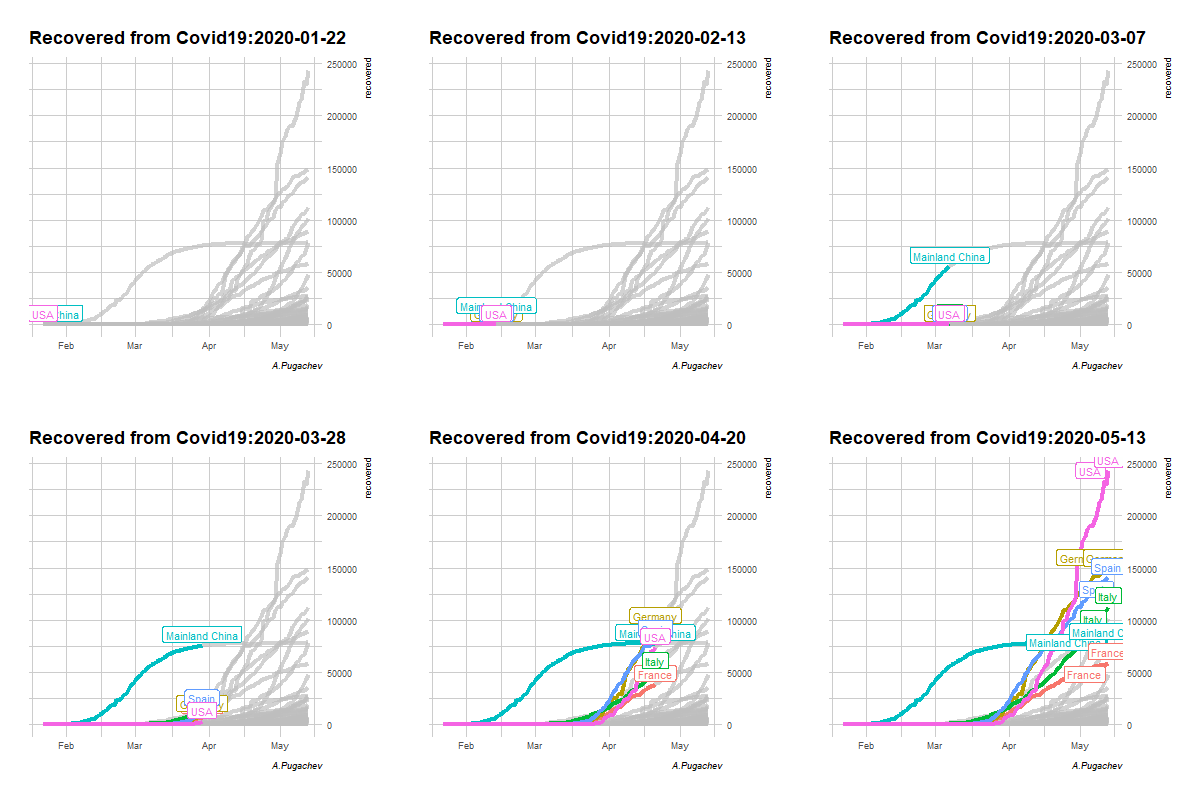
How you can create your own COVID19 graph using GGPLOT:Many data scientists use R for its outstanding feature of statistical analysis and visualization. Ggplot library is a part of the R program and has a reputation as a powerful visualization tool.
Note from the editor
Many data scientists use R for its outstanding feature of statistical analysis and visualization. Ggplot library is a part of the R program and has a reputation as a powerful visualization tool.
Editors
