Over time, we have identified a number of factors that directly influence our developers’ productivity. These…
In our first blog post, we introduced the instrumentation profiling technique which is used by some code profilers, for example callgrind or gprof. Since instrumentation…
A line of code that causes 13 % performance loss
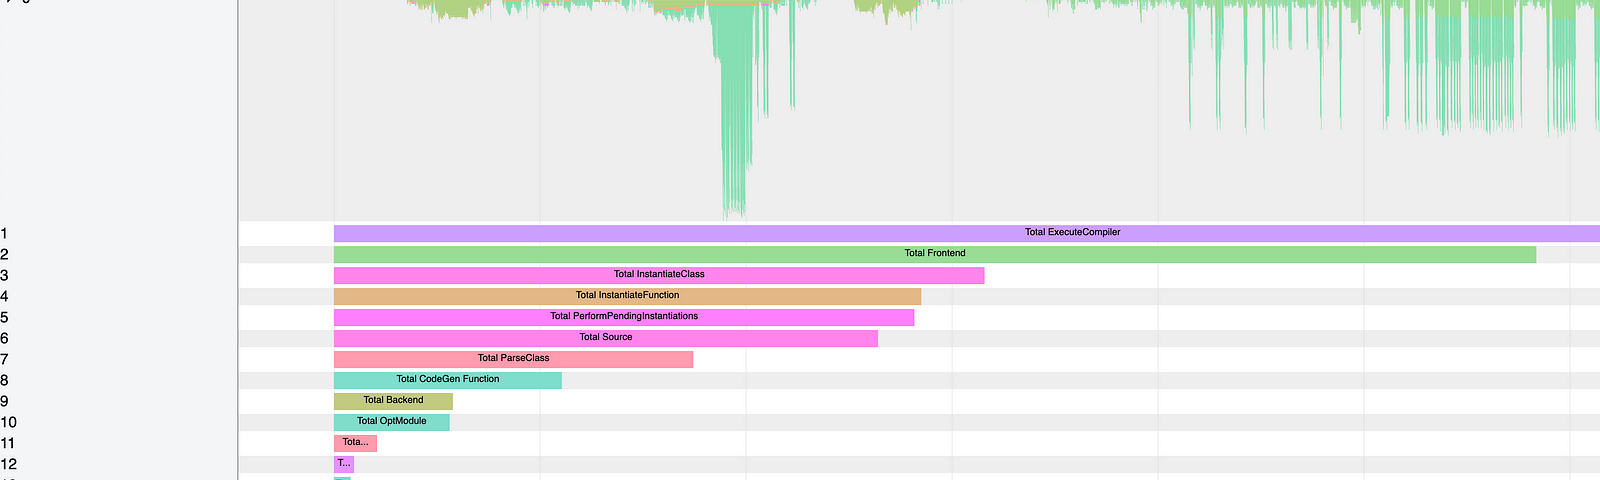
In the last blog post, we described different profilers, their usage, advantages and disadvantages. In this article, we provide an example of finding a performance bottleneck with the help of such code…
We (Adrian, Marcel and Toni) constitute the master’s project “C++ Low-Level Performance Engineering” at the Hasso Plattner Institute. The previous master’s project “Query Plan Optimizations” shared…