If Not Now When?

Contents
Executive Summary
Why Adding Multimodal Transport to Urban Land-Use Models is Important
Underlying assumptions of the proposed multi modal land-use model
- Conceptual images of rapid transit effects on land use
Characteristics of Concentrated Urban Form
Characteristics of Dispersed Urban Form
Factors that help New Zealand make the most from the multi-modal land-use model
- Spatial Planning
- More Transit Hubs
- More Organic Urban Growth
- Allocate Scarce City Space More Efficiently
- Remove Structural Bias Against Rapid Transit and Multi-Modal Transport
- Promote an Urban Design Cultural Movement
- Build Homes for the Full Housing Continuum
Appendix -Sufficient land pricing can pay for rapid transit
Executive Summary
This report was written when the Labour Party led by Jacinda Ardern won the decisive 2020 electoral victory. The public rewarded Ardern’s bold and evidence-based Covid-19 response. Saving lives was proven to be the best political and economic response to the pandemic. The New Zealand First Party did not return to Parliament. Their ‘hand-brake’ approach within the Coalition government misread the nation’s mood. The Green party were rewarded by the voters for taking a bold stance on the challenges New Zealand faces — in particular, in the areas of climate change and inequality. Kiwis voting pattern shows they want an optimistic response to the challenges the country faces. In this spirit, I hope the following analysis of transport, land-use and housing presents policy options in a positive, evidence-based, and bold manner.
This report takes a systems approach to modelling New Zealand’s housing, transport, and land-use patterns. The intent of the model is to explain key urbanism concepts and how they relate to each other. Hopefully, this provides insight into the processes that shape New Zealand’s built environment. The report has seven broad recommendations. The underlying rationales are provided explaining their importance. The recommendations are complementary to each other and should be seen as a package where the whole is greater than the sum of its parts.
The key recommendation of this report is that making room for thousands of medium density houses near transit hubs is necessary for rapid transit to be successful, and that the Government should look at providing capital grants to community housing providers to fund circa 25 per cent of these to be affordable build-to-rent properties, in a similar manner to the Austrian housing model (see the final section — Build Houses for the Full Housing Continuum). This approach provides two significant benefits, it reengineers cities to grow sustainably around rapid transit and it better supports those most ill served by the housing crisis.
These recommendations as well as addressing inequality and climate change concerns, would have significant economic benefits, not least to the Covid-19 recovery.
Why Adding Multimodal Transport to Urban Land-Use Models is Important

After three years of stable prices, Auckland’s house prices are increasing again. The monetary stimulus of reduced interest rates is pushing up house prices rather than inducing a greater quantity of infrastructure and housing construction supply.
This indicates Auckland has inelastic housing supply, which is bad for labour productivity, as gains in disposable income are lost to increasing housing costs. Unfortunately for New Zealand, high house prices prevent the country from benefiting from agglomeration efficiencies. “Restoring housing affordability will be a fundamental first step towards creating the foundation for agglomeration economies to flourish.” A recent report showed the efficiencies derived from firms and households locating close together are referred to as “agglomeration effects”. It says agglomeration benefits include deeper and wider labour markets for employees and firms, greater specialisation in the supply of inputs to production, and knowledge spillovers through local networks.
Feedback from young workers highlights the impact unaffordable housing has on the economy as a whole. For instance the statement about Wellington, “there’s a lot of gloss, but when you try to put down roots, there’s rot,”
Rising house prices also contributes to inequality, as the biggest Covid recovery stimulus — easing monetary policy — benefits the wealthier, older property-owning cohort whilst diminishing the lifetime prospects of younger and poorer renters.
During the election campaign, Labour pledged to spend $55 million to combat rheumatic fever and unhealthy homes. Rheumatic fever can affect the heart; it kills 130 New Zealanders a year, and for many others it has a debilitating effect throughout their lives. The disease is caused by housing poverty. It is very rarely seen in developed countries, as most have systematically improved their overcrowded, cold, damp housing stock. In New Zealand, cold, damp and mouldy houses are common. Unhealthy housing is especially prevalent in parts of the private rental housing sector. Fixing the systemic drivers of housing poverty is the long-term cure for housing related illnesses, such as rheumatic fever.
Politically, demands on the government to fix housing poverty is increasing. Housing crisis news articles, such as, Skyrocketing rents push people out of NZ’s most expensive city: Porirua (a rheumatic fever hotspot) and Just Fix the F***ing Housing Problem. Please! are common. The recent TV interview of housing experts, with the video titled —’We’re building houses for rich folk’ — Economist says NZ is building the wrong types of property — highlighted many of the issues this report details.
From an environmental perspective, New Zealand’s dysfunctional housing system means the country is missing out on the opportunity to build a new type of built-environment that has lower energy needs and helps the country meet its climate change target of net zero emissions of all greenhouse gases other than biogenic methane by 2050.
Internationally, there are examples of cities that have ‘built, built, built’ instead of experiencing a housing crisis — even with significant monetary stimulus. Tokyo is a good example. Compared to New Zealand cities, the Japanese megacity is easier to build in; it is larger, but provides more amenities, has a smaller climate change footprint (per capita), and has more affordable housing than Auckland.

The last major recession to hit New Zealand caused an infrastructure and construction contraction that took six years to recover from. Between April 2007 and April 2011, new house construction plummeted and residential housing consents fell by 56%. The contraction in the construction industry made the subsequent housing crisis worse, as the productive capacity of the industry took years to recover.
Modelling urban development infrastructure and land-use processes may help New Zealand to better recover from the current Covid-19 recession.
This will require some understanding of urban land-use models.

Spatial economists typically use the Alonso-Muth-Mills (AMM) model to describe competitive urban land-use markets. The AMM model assumes one mode of transport with a constant cost in proportion to distance from the city centre. The AMM model does not consider different transport modes, spatial corridors, or how that might affect the urban land market (land-use).
This paper attempts to describe a multi modal transport variation on the basic AMM model.
In New Zealand there are two cities — Auckland and Wellington — with rapid transit, i.e. grade separated public transport that is fast, frequent, and reliable. But so far this transport infrastructure has only had a modest effect on land-use. There is the perception that with the right reforms there could be more concentrated and more affordable land-use patterns around these rapid transit networks.
Infrastructure experts, such as former Chief Executive of Infrastructure New Zealand, Stephen Selwood say that New Zealand is being naïve. That the country does not understand the scale and breadth of the solutions needed to tackle issues like the housing crisis, traffic congestion and carbon emissions. His advise is much more integration of institutions that govern rapid transit, other infrastructure provision, housing supply and land-use regulation.
New Zealand also has three other tier-1 cities that could soon be eligible for rapid transit infrastructure: Hamilton, Tauranga, and Christchurch. Of these, Christchurch will be the most challenging to incorporate rapid transit to its land-use growth pattern. Christchurch, the second largest city in the country, has unique challenges. The legacy of the 2010–11 earthquakes meant the city developed in a linear-city shape (the fat banana), its urban core hollowed out (it is also called the donut city), it became more car-dependent and public transport (PT) use declined.

Changing the post-earthquake development pattern will be difficult, but it is important as the following two equations are not sustainable in the long term.

- Decades of horizontal re-zoning and subdivision infrastructure provision were brought forward following the 2010–11 earthquakes, especially in the neighbouring Selwyn and Waimakariri districts. Nearly a billion dollars’ was spent on new motorways. These factors changed the land banking dynamic and allowed a huge amount of dispersed urban growth. By 2016, this made Christchurch the most competitive and affordable housing market in New Zealand.
- But the high level of car dependency and the linear city model is a recipe for future traffic congestion and reduced mobility. These factors, as well as restrictive zoning for intensification and the city’s low density means Christchurch’s housing market will not remain competitive without further horizontal expansion. Yet the cost of each horizontal expansion iteration is more expensive than the last.

As Christchurch grows, these two equations will set the city up for another classic New Zealand congestion and housing affordability crisis. Many studies have shown that once congestion is present building new roads will not reduce congestion, as the increased road space is quickly taken by induced demand.

Even if more road building were effective, increasing infrastructure costs make it a poor long-term strategy. The increasing cost of horizontal expansion can be seen in the escalating cost of building roads in Auckland.
Funding the infrastructure needed to tackle the housing crisis is a significant problem as business journalist Bernard Hickey explains. New Zealand’s various institutions responsible for housing and transport are taking a NOMBS (Not on My Balance Sheet) approach. There is a fear these institutions do not make sensible decisions to solve systemic housing, transport, and land-use issues — instead, they transfer responsibility to other organisations and ultimately onto the most vulnerable members of society, who suffer the consequences of inadequate housing.
There is support for giving new funding mechanisms to local government but there is concern that these additional revenue sources will be wasted. For instance, Wellington councils have underfunded maintenance of its underground pipe infrastructure for decades. It is estimated that $8 billion needs to be spent upgrading pipes across Wellington, Porirua and the Hutt Valley. Infometrics economist Brad Olsen says the cost of these pipes could soon be too much for councils to handle. In Tauranga the bickering among Councilors was so bad its mayor Tenby Powell resigned and urged central government to appoint commissioners.
Given this institutional funding environment, Christchurch and the other tier-1 cities could easily repeat Auckland’s post-WW2 developmental mistake of solely focusing on outward expansion (or even take a no expansion anywhere approach), because that approach appears affordable in the short-term. This would be at the expense of a more balanced, sustainable, and fairer growth pattern over the long-term.

Auckland, like many of New Zealand’s towns and cities, used to have an extensive tram network. It also had suburban rail. From the 1950s, these rail systems could have been modernised and expanded to cope with the exploding baby boom population. Instead, the networks were defunded and largely mothballed. The progressive left at the time did not understand the multi-modal land-use model. Politicians did not advocate for the renewal of this system, which required investment following the Great Depression and WW2. The Ministry of Works (MoW) had well-developed plans for Auckland to build rail suburbs in the 1950s, as urban historian Chris Harris explains, but unfortunately these plans lacked political support.
Despite strong local support in the 1970s, exemplified by proposals like Robbie’s Rail, key decision-makers in central government stuck with the roads-only agenda. Auckland’s built environment became synonymous with motorways and automobile-centric growth. Initially this did provide affordable housing and relatively low-cost growth. But over time infrastructure costs rose, congestion increased, and the public turned against low amenity suburban sprawl and stand-alone housing (little boxes made of ticky-tacky). By the 2000’s Auckland was experiencing an intractable housing and congestion crisis. In recent decades, the city made retrospective investments in a multi-modal congestion-free transport network.
There is a growing cross-party consensus that New Zealand made a strategic mistake in not investing in rapid transit earlier. For instance, the opposition National party’s transport spokesperson Chris Bishop has said; “We made a mistake. We should have built Robbie’s rapid rail in the 70s. That is an historic generational mistake that Auckland pays the price for now.”
Building multi-modal networks too late is sub-optimal because a lack of planned public right-of-ways or spatial corridors and the built environment being stuck in auto-centric patterns adds difficulty and expense.
To avoid repeating Auckland’s congestion and housing crisis fate, Christchurch and the other high growth tier-1 cities need to invest in rapid transit and expanded public transport. They also need to invest in walking, micro-mobility and cycling to reduce car dependency. These high growth cities need their urban environments to be more productive by better allocating scarce spatial resources; they need to get better at substituting land with taller, built floor space around these multi-modal transport networks. They also need to investigate radical planning reforms to allow for intensification where there is demand for it. Plus, the cities should focus their future development around rapid transit corridors. This would result in a more balanced, sustainable growth path.
Affordable, concentrated land-use patterns in New Zealand may improve with the new urban development legislation giving Crown agency Kainga Ora greater powers. Green MP Julie Anne Genter described this opportunity in the following video. Also, the relaxation of zoning restrictions in the 2020 National Policy Statement on Urban Development (NPS-UD) will strengthen concentrated land-use patterns. The NPS, among other policy reforms, directs council zoning to remove minimum car parking requirements and raise the allowable height of buildings to be at least six stories when they are within walking distance of rapid transit.
Given the transport and land-use changes New Zealand is undertaking it is worthwhile developing a conceptual framework that adds multi-modal transport considerations to the basic AMM land-use model.
Underlying assumptions of the proposed multi modal land-use model
- The proposed model has the classic dome shape land-use pattern as described by the AMM model where land prices, building height, built floor space per hectare, housing prices, among other factors, are higher centrally.

- New Zealand cities are attractive locations to connect, meet, play, work, partner, congregate, employ, share, learn and trade with a greater number and a greater variety of people. This spatial resource is called agglomeration. This ties into what a city is, as defined by the Edward Glaeser quote: “cities are the absence of space between people”.
- This model assumes, like the AMM model, the following: The city centre has the best access to this agglomeration spatial resource; this location value is reflected in higher spatial demand for centrally located land, higher land prices, and capital substituting for land in the form of vertical, built floor space -in effect, creating new land.
- There is an equilibrium between city residents and businesses choosing between higher priced land in the centre versus lower priced, distally-located land with higher transport costs (both in time and in money). Note this is a AMM assumption used as part of the derivation of the basic model.
- The multi-modal transport model adds to the AMM model by assuming that a city can have a second system of concentrated urbanisation around its rapid transit network. Whereby land prices, built floor space and other factors are best reflected by a series of smaller domes that are fractals of the AMM model. These fractal domes are centred around rapid transit hubs. The hubs that are closer to the centre, or that are at a juncture of two or more rapid transit lines, are assumed to be larger because they provide the best access to agglomeration resources, while the distal and less-connected hubs are smaller because they provide the least amount of agglomeration benefit. This describes a polycentric city that is ‘ordered’ through transit-oriented developments. Tokyo is a lot like this. It is hard to point to a CBD, instead there are several hubs around the train stations, for example Shinjuku, and Shibuya.
- Motor vehicles can access all parts of the city and beyond. When roads are not congested, motor vehicles are the transport mode that best represents the AMM assumption of transport cost being in proportion to distance travelled. Historically, walking was the classic example. Prior to the transport technology of the industrial era, the size of a city was limited to about an hour walk from one side to the other (Marchetti’s constant).
The likely size of Christchurch with pre-industrial transport technology

- Yet compared with other transport modes, automobiles have the highest spatial requirements, therefore it is the first transport mode to hit congestion capacity limits. An underlying assumption of this model is that at least some of the time motor vehicle traffic experiences congestion capacity constraints.
- Rapid transit has lower spatial demand and therefore higher capacity i.e. it can carry more passengers per hour along spatial corridors before it becomes congested. It is also more energy efficient and has lower operating costs. It does, however, have high upfront capital costs so there is an economy of scale effect — above a certain passenger threshold low operating costs outweigh high capital costs (the per user average cost is low). At lower levels of use, high capital costs dominate and the average per user cost is high.

- The model assumes the built floor space within walking or active transport distance from rapid transit hubs is such that passenger numbers using rapid transit is in the economy of scale zone with low average costs. This either requires generous planning rules for the private sector to build upwards or a government agency (such as, Vienna’s Wohnfonds_wien) to directly master plan/positively plan the provision of this floor space, or some combination of both. It also requires a base level of agglomeration location demand.
- There is a spatial equilibrium effect in urban areas between using motor vehicles versus using rapid transit. As motor vehicle costs and travel time increase, in particular delays resulting from traffic approaching congestion limits (both with respect to free-flowing road space and car parking space), there is an equilibrium shift towards rapid transit. Note, this also means it is the speed of rapid transit that determines the speed of travel through a city once roads start to experience the congestion threshold. This is the Downs–Thomson paradox.
Conceptual images of rapid transit effects on land use
Population density along a transit line

Note land prices and built floor space per hectare will follow the same pattern.
Map view of transit lines, transit hubs and walking/active mode catchments

- Depicting grade separated mass transit (3 horizontal and 3 vertical lines)
- Mass transit hubs
- Small concentrated built environment area that is walkable in 10 minutes from mass transit hub
- Larger area bikeable or accessible with micro-mobility in 10 minutes from hub -the transition zone between concentrated and dispersed urban forms
- Other areas predominantly accessible by motor vehicle that service dispersed built environments
- The outer extent of the city’s built-environment
Characteristics of Concentrated Urban Form
- Alternative names: transit-oriented developments (TODs), the city centre, the central business district (CBD), urban hubs, urban (as opposed to suburban).
- Multi-modal transport. Rapid transit that is grade-separated from motor vehicle traffic, so it is fast, frequent, and reliable. Walking, biking, and micro-mobility friendly layout of streets around rapid transit hubs to form 10-minute neighbourhoods.
- A mix of residential, commercial, and public built environments so that most daily activities can be met within a 10-minute walk from the neighbourhood’s transit centre.
- All socio-economic groups use all transport modes on an as-required basis (mobility as a service concept).
- Heterogenous built urban-form. Many different housing types and mixed commercial/residential urban spaces. Mixed ownership models, for example: owner-occupier, short-term rentals, long-term leases, social and community provider housing etc. Multi-unit rental dwellings are common. High value public amenity buildings, such as, libraries, public sports facilities, tertiary educational centres, healthcare services.
- A high amount of built floor space per hectare i.e. taller/bulkier buildings that tend to be attached to each other to create a continuous street frontage. Built floor space can be five times the amount of the dispersed urban form.
- A low amount of car-ownership and car parking spaces per household or per commercial premise.
- Green space often collectively provided. For example, multi-unit dwellings sharing a common outside courtyard space.
- For supply to match demand for more built floor space, the concentrated urban form can either be organically built upwards around any existing mass transit hub or outwards in a new hub i.e. a transit-oriented development.

- Transit-oriented developments can be smaller duplications of the city centre thus preventing excessive outward or upward expansion of the city.

- TODs are best initiated by an entity that owns all the land (or at least voluntarily acquires the land for master planning before reallocating a proportion back to the original landowners) within the proposed walkable/bikeable/micro-mobility catchment, so it can masterplan the layout of the streets (small, porous blocks) to maximise this benefit. Also, so it can add mass transit infrastructure capital costs to the land sale price (either directly or indirectly via a targeted rate). This TOD master planning entity can be a private transport provider (the Japanese model) or a public transport government entity created by local or central government (the European model). If the rapid transit provider and the land-use developer are separate entities, then the incentives may not be aligned to build the amount of floor space needed to meet the passenger economy of scale requirement and to integrate the benefits from mass transit.
- The mass transit passenger economies of scale requirement means the built environment around each new hub needs to be constructed relatively quickly to provide a critical mass amount of residential, commercial, and public buildings so that enough passengers use the mass transit hub and the network as a whole. Crucially, TODs should not drip feed buildable plots onto the market in a way that only targets a small number of wealthier buyers. New housing needs to be heterogenous so that it can meet demand from the full housing continuum spectrum.
- Each mass transit hub can be seen as a smaller fractal of the city-wide AMM model whereby the mass-transit hub amenity value (higher locational demand) results in higher land prices that induces an effect that substitutes capital for land. Hopefully, this substitution process is as productive as possible — like Tokyo, which has more expensive land than London, yet lower housing costs (as demonstrated by the price of newly built 70sqm apartments in Tokyo versus London).
- The best way to understand this substitution process is to start with land prices. City centre land is more valuable because its centrality makes it the best location for connections, interactions, and agglomeration to occur. For mass transit hubs, a similar argument applies. Being close to a hub is the best way to access the other rapid transit hubs in the urban network and to access all the connections, interactions, and agglomeration that the city has to offer. The amenity value and resulting higher land prices sends a signal to substitute capital for land in the form of artificially building new ‘land’, by building floor space on top of floor space. In this way, building height increases, built floor space increases and density increases.
Characteristics of Dispersed Urban Form
- Alternative names: suburbia, sprawl, suburban sprawl.
- Roads and motorways are the only transport infrastructure provided. The motor-vehicle is king in this environment. There is no accessible mass transit. Street layouts are not necessarily walkable, bikeable or micro-mobility friendly. Any public transport that is provided — usually buses — are slow, infrequent, and unreliable, as services are either restricted by congested roads or low population density. The public perceive public transport to be an inferior transport option used by lower socio-economic groups.
- There is a widely held, incorrect assumption that all residents in the dispersed urban form have the financial means, desire, and the legal and physical capability to own and drive a motor vehicle for every type of urban trip.
- Homogenous built urban-form. Standalone housing dominates the suburban environment. Single house dwellings are the building vernacular. In New Zealand, this vernacular is what the construction industry and market know best, and it is what regulators understand, too. There are few mixed commercial and residential urban spaces. Multi-unit dwellings are uncommon and are often discouraged by local government zoning and by a vocal minority within the suburban community (NIMBYs).
- A low amount of built floor space per hectare i.e. single story and detached buildings are the most prevalent. Floor space per hectare can be as little as one-fifth of concentrated urban form environments.
- A high amount of car-ownership and car parking spaces per household and per commercial premises. Box-stores and suburban malls with large car parks are common.
- Green spaces are frequently private gardens.
- To match supply and demand for more built floor space the dispersed urban form can be intensified upwards by subdividing individual standalone housing plots (tending to create sausage flats) or the city extends outwards by urban sprawl. Speculative private developers with a capital gains business model tend to dominant this process.
- The number of greenfield landowners within commuting distance of the city that have zoned, and infrastructure-serviced plots determines the number of competing developers and how much localised pricing power they have i.e. how competitive or elastic dispersed housing supply is.
- Developers with pricing power use private covenants and drip-feed buildable plots onto the market to exercise this power. Affordable housing options are limited by private covenants that tend to prohibit multi-unit dwellings and small floor space dwellings and prescribe various expensive materials and other factors including bespoke designs. The purpose of these covenants and for selling sections in many stages (drip feeding) is to target higher socio-economic market segments.
Factors that help New Zealand make the most from the multi-modal land-use model
The following factors are policy proposals that follow from analysing the multi-modal land-use model. No one proposal is a silver bullet and not all would necessarily be needed, but a significant number would be required to make a cohesive multi-modal transport and land-use package. There are many interactions between the different factors — meaning a package of reforms should be considered at the systemic level rather than as a series of isolated silos. Further analysis of the multi-modal land-use model may also uncover additional proposals to consider.
1. Spatial Planning
Authorities plan rapid transit corridors in advance of city expansion by designating and acquiring corridors of land. Providing rapid transit is considerably less expensive if public land has been set aside in advance for this purpose. Examples of rapid transit spatial plans are Copenhagen’s five finger plan and Auckland’s Congestion Free Network.

2. More Transit Hubs
For duplication of transit hubs, it is important that land is acquired at the base rural or brownfield price and only fair value costs of infrastructure and amenity improvements are added to this base land price. This is important so that the value of rapid transit infrastructure is not capitalised into inflated land prices in an exploitative process which would affect inequality and productivity and would exclude a large number of people from benefiting from the amenity provided. Both amenity and affordability values need to be optimised for the concentrated urban form to be successful.
Policy makers should be aware of the 200-year-old theory of ‘sufficient land pricing’. In the early years of European settlement of New Zealand, this classist colonisation theory mutated into a method to pay for transport infrastructure, such as the 2.6km long Lyttelton rail tunnel. In the 19th century Premier Julius Vogel attempted to use this technique on a national scale to fund his massive 1870s rail infrastructure and immigration scheme. Unfortunately, Vogel could not negotiate a compact between provincialists and centralisers in Parliament to ‘gift’ the Crown with his proposed two million hectares of land around the expanding rail network — something that was pivotal to the long-term sustainability of his scheme. In the 20th century up until the 1950s, New Zealand had a form of Urban Vogelism. Chris Harris, author of Lost City: Forgotten Plans for an Alternative Auckland, described Urban Vogelism as:
This union of ideas took place in 1925 with the passage of the Hutt Valley Lands Settlement Act. Under the Act, 2.7 square kilometres of land in the Hutt Valley north of Wellington was to be developed as a new town centre, rendered accessible by a new railway and with all development gains over the initial, rural value accruing to the state…
Wellington’s suburban rail was installed as part of a state-led development planning programme. By the late 1940s this template was intended for extension to Christchurch and to Auckland, then undergoing rapid growth. Following a change of government in 1949 development planning ceased and a state highway fund was established to fund urban motorways instead…
State land development programmes accounted for 45 per cent of all housing construction in New Zealand by 1940…
Urban Vogelism is the same concept as what the British economist Professor Alan Evans calls positive planning in his book Economics and Land Use Planning, (2004, P.176–180). It is a government-led method of constructing the most critical parts of the built environment in a way that the urban area achieves high levels of amenity at low land and house prices. According to Evan’s, positive planning can produce a more compact urban form as competitively as the alternative — unrestricted outward expansion.
A mathematically worked example of how sufficient land pricing could fund transit hubs is in the Appendix.
The above historic descriptions exposes an underlying ideological division regarding governance, and it shows land and wealth policy conflicts have existed since the very beginning of European colonisation. Politically the dividing line has been the narrative about whether government adds value to the economy or not. The idea about whether it is just individual action or the marriage of government-led collective action with individual action that improves the economy.

This report contends that government actions can add value to the economy; they certainly can add value to land. Government actions, including designating public right-of-ways, building transport infrastructure, and providing public services increases location amenity value. This value is on top of that created by communities through clustering together in urban masses for agglomeration reasons. Governments should aim to optimise both land amenity and affordability values. If both goals are considered, then governments will add value to the economy while ensuring this value is accessible to the largest possible number of people.
3. More Organic Urban Growth
The National Policy Statement on Urban Development by relaxing height restrictions and removing minimum car parking requirements, will assist organic growth upwards around transit hubs. It could be extended with further liberalisation around issues such as balcony requirements, viewshafts, setback and recession plane requirements. Hyperlocalism could be considered to provide a legal mechanism for neighbours to negotiate ‘nuisance’ boundary issues, such as setbacks and recession plane requirements, in a low transaction cost manner. In this way, voluntary upzoning at a local level can help circumvent some of the community politics that restricts urban planning liberalisation.
In the UK a 2021 hyperlocalism report titled — Strong Suburbs: Enabling streets to control their own development has collected an incredible range of endorsements for more homes and community-led suburban densification, including support from:
- Ben Derbyshire of HTA, immediate past President of the RIBA
- Russell Curtis of RCKa and London Mayor’s Design Advocate
- Peter Eversden, Chairman of the London Forum of Amenity and Civic Societies
- Andrew Boff, London Assembly Member and Chair of the Planning and Regeneration Committee
- Lord Matthew Taylor of Goss Moor
- Christopher Boyle QC, Chairman of the Georgian Group
- Sir Robin Wales, former Labour Mayor of Newham
and a supportive quote from the Secretary of State, Robert Jenrick.

New Zealand has three possible city block design solution for more organic growth (H/T Heidi from Greater Auckland). With option number one being the current default decision.
- Recession planes and setbacks are retained. Individual plots are intensified with one house being replaced by a row of townhouses built alongside a long driveway. This option has a low amount of built floor space and high site coverage of impermeable material (buildings, driveways).
- Perimeter block housing type of three to six stories. Individual sites being able to build side boundary to side boundary, but required to keep a large permeable back garden, not covered in car infrastructure, or
- Some other form, with apartment buildings designed more as a standalone unit, for which the on-site permeable garden space requirement is not so arduous, but the developer needs to contribute towards buying up properties to turn into hyperlocal pocket parks.
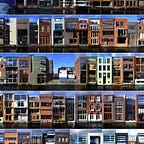
In summary in New Zealand it is easier to build potion one — sausage flats as depicted in the aerial view of Royal Oaks in Auckland

Than it is to build a perimeter block development.

Organic urban growth options two and three would be more suited to walkable neighbourhoods centred around a rapid transit hub. Unfortunately New Zealand’s height to boundary guidelines prevent either of these options so the urban growth is more headed towards a low rise, impermeable, barren sprawl pattern
4. Allocate Scarce City Space More Efficiently
Urban and economic theorists have well developed ideas for achieving this, in particular, congestion road pricing, car parking management policies and shifting property taxes to land value rates (so that land is taxed more and buildings less).
- A recent study of 545 European cities shows that congestion charging and public transport when it is separated from congested roads (so not regular bus services) was the most effective policy mix for relieving traffic congestion. Motorway construction both by increasing the size of the network or adding lanes to increase capacity due to traffic quickly reconfiguring itself meant there was no relief from traffic congestion.

- Urbanist Alain Bertaud discusses both car parking and congestion pricing in his new book ‘Order Without Design -How Markets Shape Cities’ (car parking on page 199).

And congestion road pricing on page 200.

- Economist and urban planning Professor Donald Shoup author of the influential 2005 book The High Cost of Free Parking, has said in a paper titled Parking Reforms Could Be the Easiest Pollution and Economic Fix that “municipalities can charge the right prices for curbside use, spend the revenue on the right public services, and remove off-street parking requirements. Each reform alone may not look compelling, but they work well acting together.” Shoup’s paper The ideal source of local public revenue gives a thorough description of the link between Georgist theory and managing spatial resource ‘commons’. This provides the underlying theory behind congestion pricing and car parking management. It also describes the theory behind taxing land rather than buildings.
- Local government rates that tax buildings rather than land have the perverse incentive of taxing intensification i.e. it inhibits the productive substitution of land with capital. It also encourages the land banking investment strategy. This can easily be seen in the following two photographs showing approximately the same land area (about 1200sqm) roughly 100m apart in Christchurch’s city centre. The one on the left is a hotel catering for 100 guests — it has a bar, café, restaurant and 48 staff. The land on the right is carparking for 36 cars. The annual rates bill for the hotel is $153,453 while the car park pays just $14,139. A further discussion of this effect can be read in the Saving Christchurch’s CBD paper.

- In New Zealand fringe benefit tax (FBT) is not imposed on employee provided car parks. Yet, free car parking is a strong inducement for greater use of single occupancy vehicle use. This tilts the systemic equilibrium in cities towards greater motor-vehicle use. The best way of leveling the playing field would be to remove the fringe benefit tax exemption for carparking. If that is not politically possible then a good alternative would be to exempt employee provided public transport passes from FBT. Another alternative would be to offer people the option to “cash out” employer-provided carparks.
Using these Georgist techniques to more efficiently allocate city spatial resources means private costs are not socialised and community created agglomeration gains are not privatised. Gains that are the result of community action, such as increasing land prices, or costs that individuals impose on others, such as congestion, incur a charge that either discourages the activity or provides funding for the community to remedy the situation. For instance, by providing alternative congestion free transport networks, or by funding public infrastructure, such as sewerage and fresh water systems, so that floor space built on floor space can more productively substitute for land.
Tokyo is an example of a successful city that efficiently allocates scarce spatial resources. In particular, Japan does not subsidise motorists, this has created a much stronger and more efficient multi-modal transport and land-use system.
New Zealand needs to be more entrepreneurial in its policy settings. For example, New Zealand like much of the West would probably reject elevated rapid transit in built environments because it would be seen as creating blighted, dangerous ‘dead areas’ that separate rather than connect.

One lesson that Japan has learnt is that for these difficult spaces, these gaps or cracks in the city where somehow public space doesn’t work, let entrepreneurs in, give them low rental prices and give them freedom and they can turn that space into a magnet, even a connector, not a barrier
5. Remove the Structural Bias Against Rapid Transit and Multi-Modal Transport
Currently, central government funds state highways for 100 per cent of their cost and about 50 per cent for local roads. This funding comes from the National Land Transport Fund (NLTF), which itself is funded by road user charges and fuel taxes. In practice, this means the NZ Transport Agency (NZTA) builds new state highways and local authorities focus on road maintenance. The NZTA is one of the government’s premier capital building entities, yet its history and funding arrangements has made it focused on roads rather than multi-modal transport systems. Changing this institutional culture will be difficult.
Public transport operations are funded approximately 50% user, 25% local authority, 25% NZTA (Waka Kotahi) from the National Land Transport Fund. Generally, councils do not build much new road or transport infrastructure. In new subdivisions private sector developers build local roads and gift the roads and the liability for their long-term maintenance to local councils. This system incentivises local authorities to, somewhat dysfunctionally, compete for new state highway projects while minimising its local road maintenance liability.
There is a myth in New Zealand that roads do not need subsidies. There is little public knowledge that local roads are funded by a rough 50/50 funding split between the NLTF and local government rates. This means maintaining the road network is significantly subsidised by ratepayers (households). Some households do not drive or would like to use other transport modes, yet the rating system means those households who drive less have to pay as much for damaged roads as those that drive more (note heavier vehicles do considerably more damage to roads). Road maintenance is one of the biggest expenses for New Zealand local councils, so this is a significant issue.
Perhaps the simplest way that central government can fix this bias is to provide 100 per cent funding for rapid transit projects while allowing targeted rates around transit hubs to recoup some of this funding.
An economically purer solution would be to switch the NLTF to a road maintenance fund that pays 100 per cent of road maintenance costs, with no burden on ratepayers. The economics and politics of remaking the funding compact between local and central government may be difficult, though. Talking Transport does a good job summarising these issues.
6. Promote an Urban Design Cultural Movement

The concentrated housing types the multi-modal land-use model indicates would benefit New Zealand would be a sea change in how Kiwis think about the urban environment.
A urban design research institute, forum, body or movement that brings together multiple housing, transport and land-use disciplines and perspectives in a cross-pollination engagement process would be beneficial. This process should be outwardly facing so that it improves the publics understanding of the urban environment. Over time this could be culturally significant.
This could influence many systemic changes to the construction industry, such as, updating of the building code for intensification building types; it could require design competitions to help the industry be more innovative; there could be more funding for research, development, education and training — perhaps whole new schools, industry accords, and so on. This is all so that capital can more productively substitute for land.
The European Union (EU) is investing in a modern version of the Bauhaus construction movement — a co-creation space where architects, artists, students, engineers, designers work together — in response to Climate Change and to help stimulate the Covid-19 recovery.
New Zealand could do something similar, creating an urban design movement to collaborate, innovate, research, and teach the country how it can construct the concentrated built environments it needs.
A New Zealand urban design cultural movement could help address multiple challenges, including climate change, the Covid-19 recovery, and the housing crisis.
New Zealand should use Māori wording (te reo) for this proposed urban design movement. It should reflect cultural processes that are indigenous to New Zealand but learns from overseas, too. As the European Commission President Ursula von der Leyen says, “Every movement has its own look and feel. And we need to give our systemic change its own distinct aesthetic — to match style with sustainability.”
Indigenous cultural concerns have to go beyond just using a te reo name for the design movement. An urban design cultural movement needs to consider how Māori, Pacific Peoples and other ethnicities have been disproportionately affected by the poor state of housing in New Zealand.

In New Zealand Pacific Peoples and Māori are the ethnic groups with the highest renting figures — over 50 per cent of people in these groups rent.
This report contends that a significant proportion of the capital funding for housing should go to charitable trusts which build papakainga housing so that housing better meets Māori cultural and accommodation needs. Architectural designer and housing advocate Jade Kake describes this opportunity in a paper titled -The future of papakainga: there’s no place like home .
Community housing providers which focus on improving rental accommodation for Pacific Peoples should also receive a significant share of housing capital funding, too.
The circular economy concept would be an important part of the urban design movement. It would bring in the whole nation rather than be limited to reforming cities.
The circular economy would include investments around the country in renewable energy projects needed for the transport system to electrify (a 60 per cent increase in renewable electricity production is estimated to be needed over the coming decades). Government planned investments in pumped hydro and a ‘green grid’ will encourage investment in increased renewable electricity production.
The circular economy could also include vertically-integrated engineered-wood construction companies. These companies could own sustainable forests in rural New Zealand, operate regional milling operations and prefabrication factories, and — in urban areas — the building design software applications that could construct high-amenity built urban environments.
Helsinki’s port redevelopment — Wood City — shows it is possible to replace concrete with large-scale, multi-storied wooden buildings. This approach constructs the built environment by substituting land with capital in the form of stored carbon. The New European Bauhaus movement is intended to have demonstration lighthouse projects. Something like a Wood City suburb could be an exemplar of New Zealand’s urban design cultural movement. Design competitions discussed in the next section could be a mechanism to find innovative ‘lighthouse’ projects.
The benefits of a Wooden City suburb would be greater in New Zealand than in Finland because of the seismic strength of engineered-wood. Also, low-energy, warm, dry and well-ventilated passive housing could easily be achieved with engineered-wood technology. This is something New Zealand’s housing stock desperately needs.
Wood processers are promoting a carbon-zero construction vision for New Zealand. Especially Marty Verry who is chief executive of the Red Stag group, which operates the Southern Hemisphere’s largest sawmill with vertical integration form forestry to property development. Marty Verry has written several articles and podcasts requesting the government to undertake this strategic vision as part of the Construction Sector Accord.
Initially, the urban design movement would likely focus on large, government master-planned projects to build economies of scale; but as the movement gathers momentum, organic building would also benefit as the greater productivity of intensification would transfer to this environment, too.
Given New Zealand’s size a good way to keep up with technology advances needed for the urban design movement would be to have a strengthened ‘hands-on’ Ministry of Works-type government department. The private construction sector struggles enough not to go bust, let alone keeping New Zealand’s construction technology progressing in a systematic manner. In Japan, they have eight large construction companies that develop technologies, but New Zealand’s construction industry does not have that scale. Other Asian countries like Taiwan have the equivalent of a MoW, at least in terms of progressing earthquake engineering.
7. Build Houses for the Full Housing Continuum
Renting in New Zealand is bad. The bottom 20 per cent of income earners spend a greater proportion of their income on rent than anywhere else in the OECD.
The government should have an explicit goal that for the lowest 20 percent of income earners their housing costs as a proportion of income should be below 30 percent. An independent housing commissioner as outlined in the Rack-Rent series of articles would be a logical method for ensuring a consistent, transparent, accountable, and political sustainable for achieving this goal.

The number of public houses would need to double or treble to seriously dent the number of stressed households who pay more than 30 per cent of their income in rent. This would require a building programme similar to the Urban Vogelism of the First Labour government; once the effects of WW2 is accounted for, that government built about 30,000 state houses in a decade at a time when New Zealand had one-third of the population it does now.
The government plans to build 18,000 public houses between 2017 and 2024. In her recent campaign announcement on housing, Prime Minister Jacinda Ardern said: “We actually have a very proud record — in public housing in particular — of building more houses than we’ve seen any government build since the 1970s … we can’t turn this problem around in one term when it took decades to create.”
This government support for house building is a start, but only that. Hopefully, the government will further increase its capital spending on house building because there is a huge gap between current government housing outputs and the estimated 180,000 low-income households which pay more than 30 per income of their income in rent, or the 254,000 children living in low-income households.
The government will need to greatly increase capital funding assistance to low-cost new builds to deliver Ardern’s 2030 vision where New Zealand has halved the number of children living in poverty, there is no one on the state housing waiting list, health inequalities based on race, wealth and geographical location no longer exist, and the country runs on 100 percent renewable energy (full 2030 vision speech here).

Since the 1990’s, government capital investment in housing has decreased and consequently the proportion of low-cost affordable housing types being built has dropped.

A hint of what a larger social housing response might look like is the Poundbury extension of Dorchester in England. Poundbury is a master-planned development undertaken by Prince Charles that has its own particular built environment vernacular — traditional urbanism. Guinness Homes, one of the largest providers of affordable social housing in England, has been heavily involved in the Poundbury master-planned development. Prince Charles insisted that 35 per cent of the housing in Poundbury be social housing and that this housing be indistinguishable from the general market housing.
Despite initial fears about the large number of social houses in Poundbury, sales of general market housing have not been affected. There was no negative effect on house values for homes higher up the housing continuum.
There is an impressive array of employment opportunities within Poundbury’s urban development area, further improving its diverse character. Mixing residential and commercial building typologies has worked well.
By integrating social housing in a manner that is indistinguishable to general housing, Poundbury reduced the exclusionary fear social housing can attract. In New Zealand, it is common to hear that state housing will become a slum for an unwanted ‘underclass’, create a gang ghetto, foster drug-use, or increase criminal behaviour among other pejorative slurs.
For example, in Hobsonville Point, the 2007 planned conversion of an unneeded military airbase into a residential suburb, then opposition leader John Key called the proposal that 15 per cent of housing be state housing “economic vandalism”.
Consequently, no state housing or community housing provider rentals were built in Hobsonville. There were only a few private sector build-to-rent houses constructed by the firm New Ground Capital in partnership with Ngai Tahu Property and the NZ Super Fund.
Hobsonville does, however, have an affordable owner-occupier housing requirement that 20 per cent of houses need to be ‘axis series’ housing. Meaning they are sold for prices similar to Auckland KiwiBuild prices, which we know is too expensive for most renters.
In summary, Hobsonville had no requirement for, and little if any housing built, targeting the low-income end of the housing continuum. It did not cater for minimum or living wage workers needing affordable rental housing despite there being considerable demand for this type of housing.
The lack of housing supply for low-income households is exacerbated by a significant gap in the financial support provided by the government for this part of the housing continuum.

The progressive politics principle where people with the least pay a lower tax rate and receive more government support is, unfortunately, not followed in the way housing is supported in New Zealand. There is a gap, affecting about 360,000 long-term rental households, between the considerable support given to the vulnerable state house tenants and the moderate support given to middle-income first home buyers.
Rent payments from state house tenants only contribute about a third of the funding for the state housing scheme — the government subsidises the remainder through the Income Related Support Scheme.
Middle class first home buyers are able to buy a home with the assistance of schemes like HomeStart, KiwiSaver and KiwiBuild.
HomeStart grants can be as much as $20,000 for a couple if they build a new home. First time home buyers can also utilise their government subsidised KiwiSaver savings and can purchase KiwiBuild houses, which has had government funding (the KiwiBuild programme in 2017 received $2 billion in seed capital funding).
Build-to-rent housing types receive none of this preferential treatment.
If the progressive politics principle held, then low-income renters should receive greater assistance than HomeStart grants and other middle-income home ownership supports on a per household basis, but less than state house tenants.
That support for build-to-rent housing should be in the form of capital grants in exchange for affordable, contractually stable long-term rent. This would be better than income support payments (the Accommodation Supplement) for existing rentals which has led to higher rents in tight housing markets.
In some ways giving capital grants to housing makes more sense than giving capital grants to transport projects, as properly configured housing schemes (the land underneath the houses is the ‘sufficient land price’ funding mechanism — full worked example in the Appendix) could significantly contribute towards funding transport costs while also providing greater support to those in housing need.
The economic case for giving capital grants to intensification housing projects near transit hubs includes helping the passenger economy of scale threshold be reached. Also, economies of scale can make construction technology transfer and innovative processes like greater prefabrication more viable. This would increase housing quality and decrease per unit production costs more generally. Another economic advantage is tapping into demand for more affordable build-to-rent housing can induce a far greater housing supply response than only focusing on the demand from build-to-own house buyers.
Countries such as Austria, that use housing capital grants, have lower rents and a more stable construction sector, among other benefits.

The key aspects of Austrian housing policy are as follows.

In some ways Bausparen the Austrian government-subsidised saving scheme is not that dissimilar to KiwiSaver.
In New Zealand, there is the intriguing recent example of a KiwiSaver provider contributing $15 million towards a Salvation Army housing development, believed to be the first investment of this kind in the country.
If this trend is encouraged, say by government switching towards housing capital grants and by allowing community housing provider tenants access to their KiwiSaver accounts for an equity contribution to the rental, then KiwiSaver providers could be part of a circular savings and affordable new-build housing economy. This circular economy would be more sustainable because it does not require speculative capital gains.
Housing Associations are the anchor of the housing system in Austria. 28 per cent of new houses are built by housing associations. Austria has 200 housing associations which manage 700,000 dwellings. Each housing association manages an average of 3,500 dwellings.
Housing associations are audited each year by an umbrella organisation (the Austrian Federation of Limited-Profit Housing Associations) and their regional government. The equivalent in New Zealand is the non-profit community housing provider sector, which also has a national body and is audited by government.
In Vienna, land for new housing estates is acquired by the city-owned Housing Fund (it was probably a mistake for New Zealand to set up a $2 billion seed fund for KiwiBuild without setting up a similar sized land acquisition fund). For Austria having an active land acquisition management mechanism in its most expensive urban land market has been crucial for the success of its capital investment approach to housing. Integrating housing with Vienna’s rapid transit system (the U-Bahn) is standard practice. The new urban district Seestadt Aspern is a good example of what we in New Zealand might call Urban Vogelism or ‘positive planning’.
In order to develop higher-quality housing and to stabilize building costs, the city introduced developer competitions. Each subsidised housing project — some 7,000 to 13,000 apartments annually — are judged by an interdisciplinary jury along four sets of criteria:
- social sustainability,
- architecture,
- ecology, and
- economics.

Austria has used developer competitions to influence the built environment vernacular. Austria has a highly successful Urban Design Movement, which recently has focused on issues like energy efficiency with passive housing.
The efficiency of using developer competitions is backed up by similar experiences in other jurisdictions.
“The Pennsylvania Housing Finance Authority in the United States awards funding to social housing project developers in a competitive bid process in which competing proposals are ranked using a point system, and those projects with the highest number of points are funded. In 2015, that agency started awarding additional points to certified Passive House projects.
“In the first year of offering this incentive, with virtually no Passive House projects in the state, the incremental cost of Passive House over conventional construction per square meter of floor area was 5.8% but dropped to 1.6% in the second year. By the third year of the incentive, the average cost of successful Passive House projects was 3.3% less that the cost of conventional projects. Over the first three years of the program, the 74 Passive House projects funded were an average of 1.7% less expensive than the 194 proposals for conventional construction.
In Austria, housing association tenants can contribute equity. Prospective social housing tenants typically make an equity contribution of €50–60 (about NZ$100) per sqm, or circa €2,500 to €5,000 per home. If tenants live in a social house for over 10-years, they have a right to buy it. If they did not contribute equity before their tenure began, they do not have that right.
A benefit of New Zealand adopting this system is the 10 year wait to buy prevents either, the community homes coming onto the market immediately and selling at a high capital gains price — which would reinforce the New Zealand property capital-gains mentality. Or a rapid flood of low priced homes onto the market causing financial and political stress from a rapid downward price correction to the wider housing market.
In New Zealand’s housing market there is now high expectations of capital gains. This is mostly driven by landlords capital gains business model (as opposed to a rental yield model) and by renters wanting to buy due to ‘fear of missing out’. A monthly survey recently indicated a net 88 per cent of real estate agents are seeing FOMO. Back in May a net 2 per cent said there was no FOMO.
A large government build-to-rent programme, such as the Austrian housing model, could largely remove demand coming from tenants fear of missing out and landlord capital gains expectations.
Building for the full housing continuum especially if combined with the other recommendations may over time cause a downward house price correction, but it is likely to be a slow deflation over a long period, as it will take a decade or more for supply to take full effect on the wider housing market. Home ownership demand from private rental property investors and renters who have ‘fear of missing out’ (FOMO) will though decline quickly. In the short term this demand effect is likely to have the greater impact.

The main form of government subsidy for Austrian housing associations is fixed low interest loans. In New Zealand, we could give community housing providers capital grants so they can provide subsidised rentals. A Construction Future Proof Fund could also be created to dispense construction grants for energy efficient, seismically strengthened or carbon sequestering buildings. The linked article also documents how many countries in Europe and North America are using social housing to move the built environment vernacular towards energy efficient passive housing.
Austrian housing association rents are cost based. Unlike New Zealand state houses, rents in the Austrian social housing sector are rarely based on the tenant’s income level. There is a requirement to balance costs and revenue at the level of the individual development. i.e. the costs (net of subsidies received) of each housing project are covered by the rents charged. Prospective tenants need to demonstrate they have ability to make the rent payments.
This delivers social housing to a much larger segment of the population (24% of households). The main tenants are young families and those on lower incomes. The average rent for a social home in Austria is €433 per month (NZ$177 per week). Rents this affordable would be less than 30 per cent of a full-time minimum wage worker’s income in New Zealand.
Vulnerable low-income tenants in Austria who cannot afford their rent have access to a means tested rent subsidy. This is about 5% of households — a similar proportion to state housing households in New Zealand.
In the very long run when the stock of affordable rentals is high enough then the community housing capital grant system could replace the $1.6 billion Accommodation Supplement that the Pre-election Economic and Fiscal Update forecasts will climb to $2.6 billion in 2022.
Austria shows that when the bulk of housing subsidies goes towards capital investment then this produces better housing outcomes, at a lower government and household cost as a percentage of GDP.

The problem for New Zealand, which should be seen as a social or well-being investment, is the transition to a system of housing capital investment from one that largely subsidises rental expenditure would require a period where both systems are funded. This phasing in and out period would likely take one to two decades before the combined stock of community housing provider houses and state houses would be large enough that subsidised private sector rental housing would not be required.
In the long run this transition may lower New Zealand’s debt levels, especially household debt, as it has done in Austria. This should add a significant amount of resiliency to the New Zealand economy.

If New Zealand adopted the Austrian housing model it would likely help stabalise house prices as it has done in Austria, although this is likely to require the private sector supply factors recommendations in this report to be implemented as well.

Appendix -Sufficient land pricing can pay for rapid transit.
If a state-run Special Purpose Vehicle using medium density housing types (i.e. apartments, townhouses, terrace housing) was able to build 3000 to 4000 dwellings within an 800m (10 minute) walk of a rapid transit hub, this could contribute significantly towards funding the capital costs of rapid transport.
For instance, if a rapid transit infrastructure charge were added to each residential plot — either directly, or indirectly through a targeted land value rate — to an average value of $30,000 per dwelling, this would fund about $100 million to contribute towards the rapid transit capital costs of that transit hub.
For the households in the TOD a $30,000 capital charge is likely to be considerably less than the capital costs for additional motor-vehicles and garaging that dispersed built environments without transit require. So, a transit capital charge on land does not necessarily add to the cost of providing affordable housing. It does though mean the city is able to offer a different housing, transport, and land-use package which a significant proportion of city-residents may prefer.
Having 3000 to 4000 dwellings within walking distance of rapid transit would generate a healthy demand for rapid transit that are fast, frequent, and reliable. Fare revenue from such a large number of passengers could cover operating costs.
3000 to 4000 dwellings within walking distance of rapid transit would be fairly typical for a European transit-oriented development that covered a full 360° circle from the transit station. In fact, in more central city locations the numbers are much higher. 3000 to 4000 dwellings works out to be approximately 50 to 100 dwellings per hectare, which is five times greater than a typical New Zealand standalone housing suburb that has 10 to 20 houses per hectare. This calculation also assumes a generous allocation of space (about half the area within the circle) for commercial buildings, a fine-grained porous streetscape and public places like nature reserves, schools, sports fields, and the like.
If the government subsidised the construction of 25 per cent of these dwellings through an Austrian type social housing programme and perhaps another 10 per cent via state house funding, then this could indirectly fund a good proportion of the rapid transit costs — both the high upfront capital costs and the relatively low, ongoing operating costs.
If the rate of subsidy for the Austrian type social housing programme was for illustrative purposes a capital grant of $150,000 per new-build, then a $900m a year fund would build 60,000 Austrian-style social houses in a decade. This would significantly reduce the number of households paying more than 30% of their incomes in rent which was estimated to be 180,000 households in 2018.
Note, sufficient land pricing would work in locations where large scale land acquisition is possible because the cost can be spread over a sufficiently large number of residential buyers, and the buyers would prefer the type of housing and infrastructure package offered, so are prepared to pay the infrastructure costs (economists call this revealed preference). But for cases where a new rapid transit hub is provided retrospectively in a typical dispersed New Zealand suburb there will be fewer residences within walking distance. Also, targeted rate funding, at an average of $30,000 debt per household might be considered quite steep as some existing households may not prefer rapid transit because it was not an option when they first chose their residential location.
Over time, rapid transit even if built retrospectively would result in the construction of more built floorspace, perhaps eventually equaling the amount that a planned in advance approach would have supplied. But it is hard for a targeted rate to capture this potential revenue source prior to the changes in the built environment for the reasons detailed in the previous paragraph.
It is possible though as the built floorspace increases, there are local productivity gains, as more people benefit from the agglomeration economy. This leads to a greater tax take more generally — on worker income, business profits and consumer spending. Cost benefit analysis might indicate this would repay rapid transit infrastructure costs thus justifying government funding from the general taxation pool (the consolidated fund). Other benefits to the environment, climate change or poverty reduction can also be added to the cost benefit calculation.