Homepage
Open in app
Sign in
Get started
All stories
How To & Career
Historic Data Viz
We moved to: https://nightingaledvs.com
Tagged in
D3js
Nightingale
We moved to
https://nightingaledvs.com
!
More information
Followers
16.6K
Elsewhere
More, on Medium
D3js
Maxene Graze
in
Nightingale
Jan 13, 2021
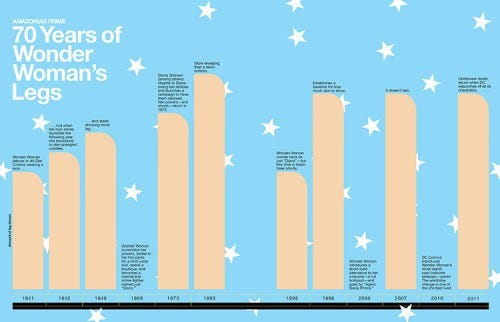
Typescript: D3’s Loyal Sidekick
My roadmap to becoming a D3 Wonder Woman
Read more…
127
4 responses
Abhilash
in
Nightingale
Jan 4, 2021
Do You Still Read Newspapers?
Tracking the circulation of newspapers across States and Union…
Read more…
134
6 responses
Joseph (Geolic)
in
Nightingale
Aug 28, 2020
Creating an Interactive d3 Choropleth Map in React Native
Adding data-driven colorization as well as…
Read more…
59
Joseph (Geolic)
in
Nightingale
Jul 8, 2020
Creating a d3 Map in a Mobile App Using React Native
Adding DataViz to native apps has great…
Read more…
173
Rachael Dottle
in
Nightingale
Jul 1, 2020
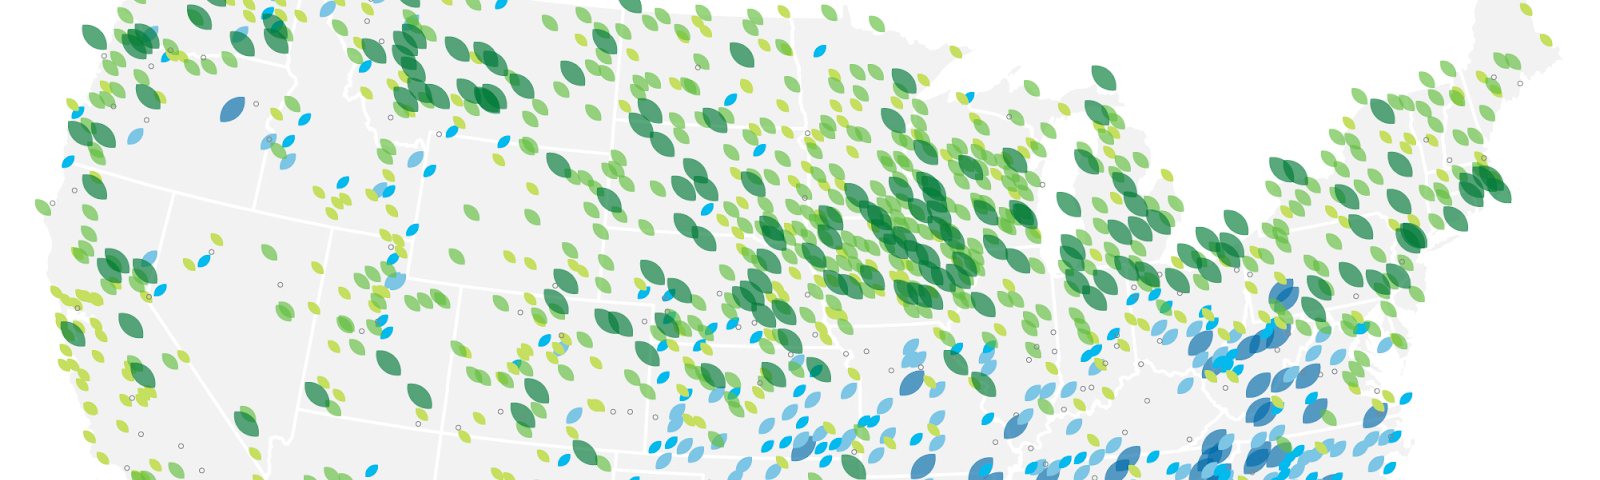
Re-viz-ited: Mapping an Early Spring
In this remake, we learn about a handy new Illustrator plug-in…
Read more…
77
4 responses
Bill Shander
in
Nightingale
May 14, 2020
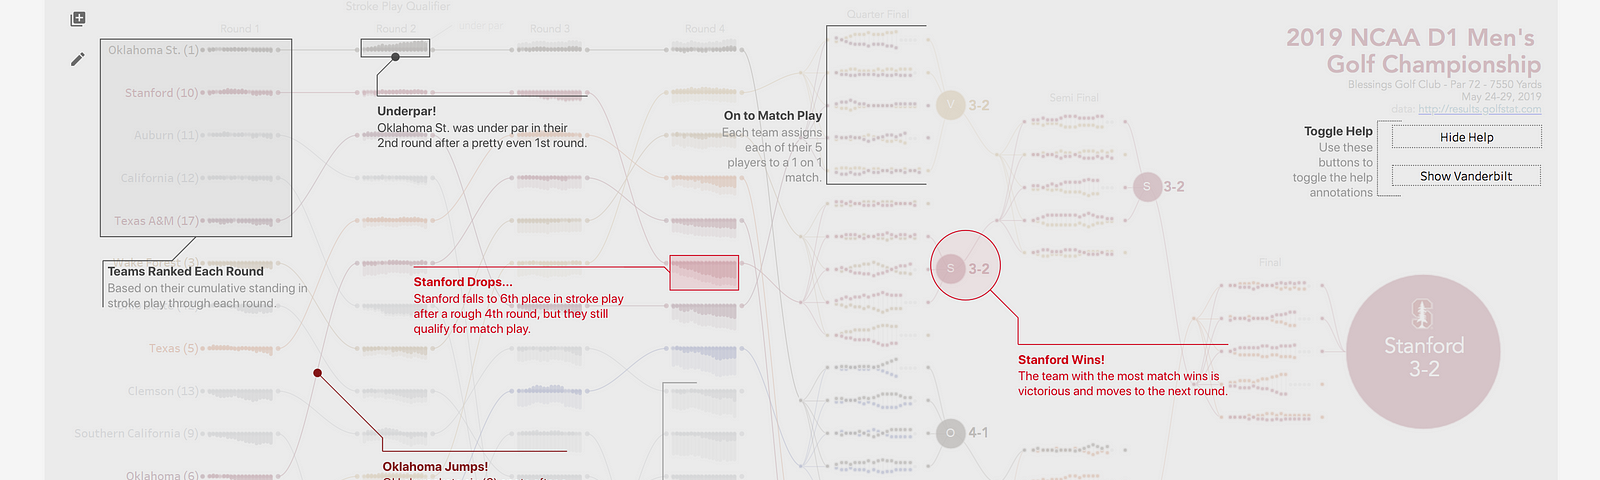
Creating a Multisegment Scrollytelling Data Story From Scratch: Key Moments and Lessons
Read more…
327
1 response
Christopher DeMartini
in
Nightingale
May 1, 2020
Use the Right Tool for the Job
Take advantage of the convergence and integration of visualization…
Read more…
173
1 response
Christopher Lanoue
in
Nightingale
Apr 28, 2020
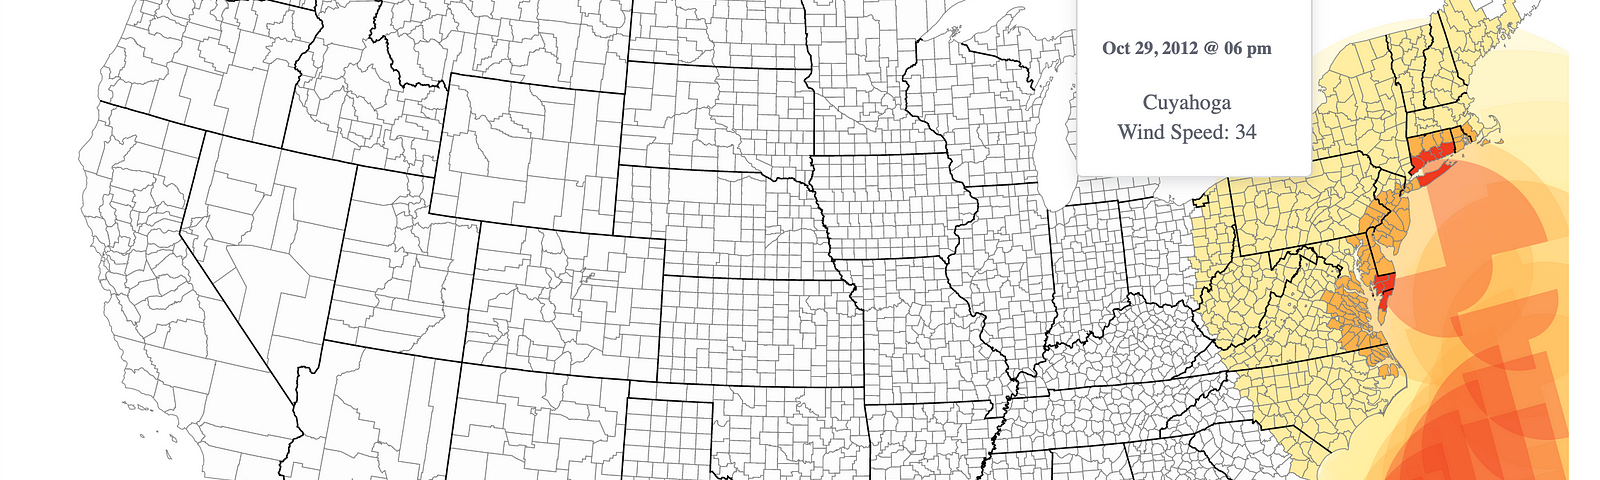
Identifying Affected Customers in a Disaster
Visualizing Hurricane Sandy in less than 10 minutes
Read more…
184
Rachael Dottle
in
Nightingale
Apr 20, 2020
Re-Viz-ited: Every Volcanic Eruption Since 1880
In the first installment of a new series, one data…
Read more…
123
Marina Silivestru
in
Nightingale
Mar 25, 2020
Maths for Drawing Circles
Circles are a foundational shape in data visualization, but drawing them…
Read more…
251
1 response