Homepage
Open in app
Sign in
Get started
All stories
How To & Career
Historic Data Viz
We moved to: https://nightingaledvs.com
Tagged in
Graphic Design
Nightingale
We moved to
https://nightingaledvs.com
!
More information
Followers
16.6K
Elsewhere
More, on Medium
Graphic Design
Encode team
in
Nightingale
Nov 17, 2020
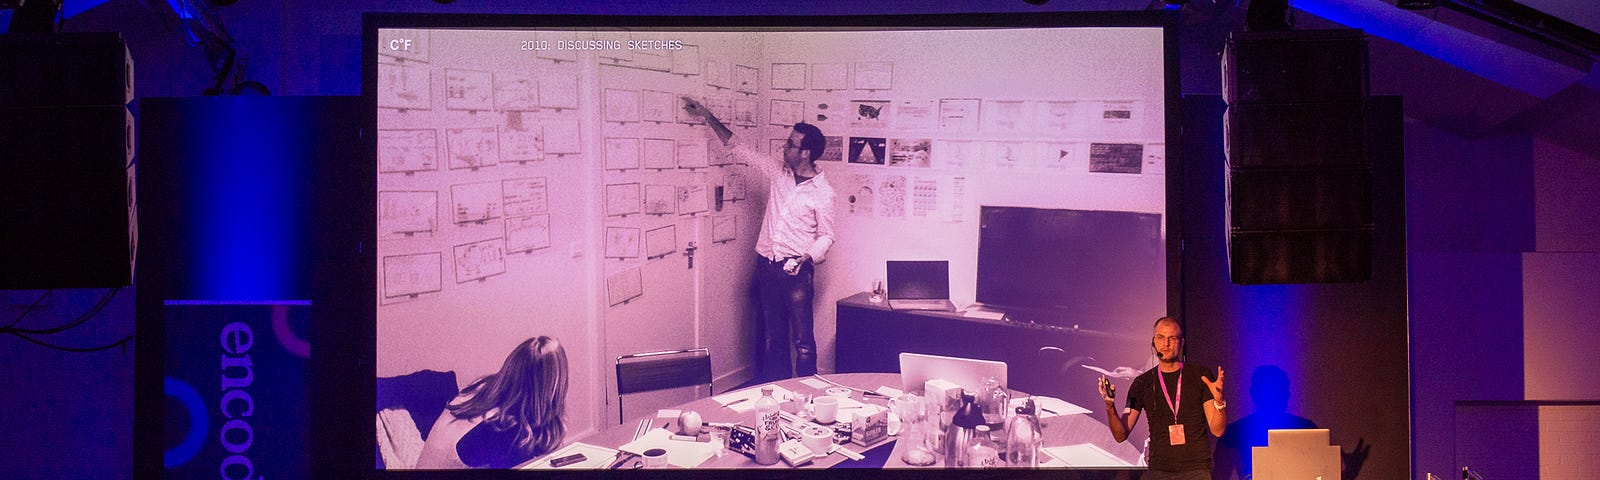
Growing as Designers, with CLEVER°FRANKE
This article is an excerpt from the
Encode
2019
Festival Guide, and it’s part of our…
Read more…
101
Tiffany France
in
Nightingale
Jun 8, 2020
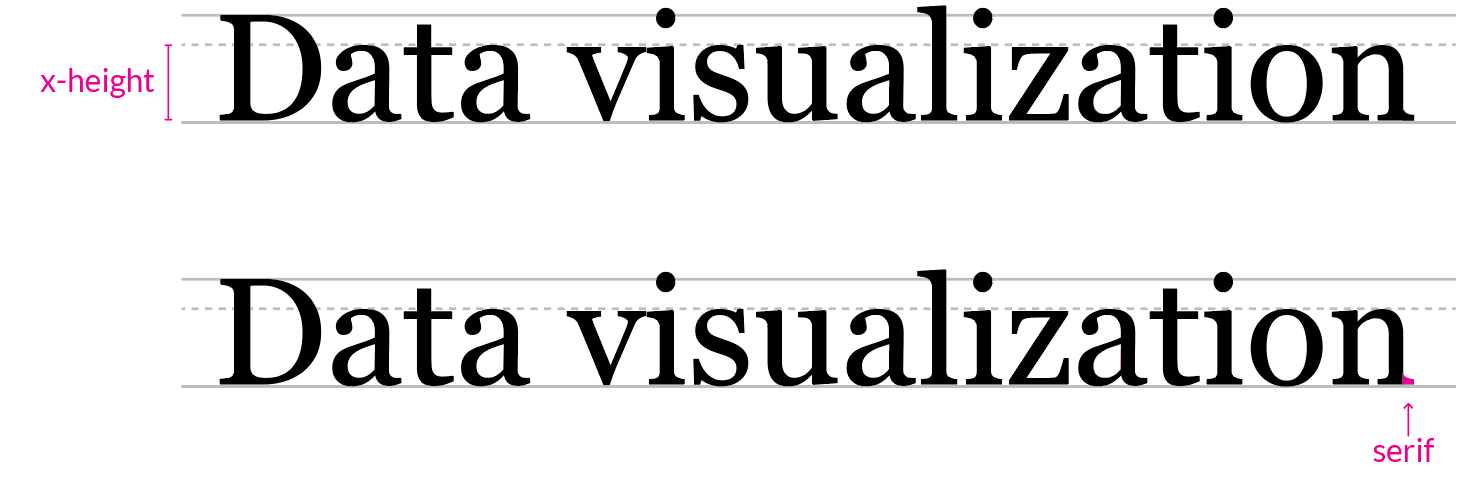
Choosing Fonts for your Data Visualization
Text accompanying graphics should be easy to read to the…
Read more…
1.4K
7 responses
Duncan Geere
in
Nightingale
May 19, 2020
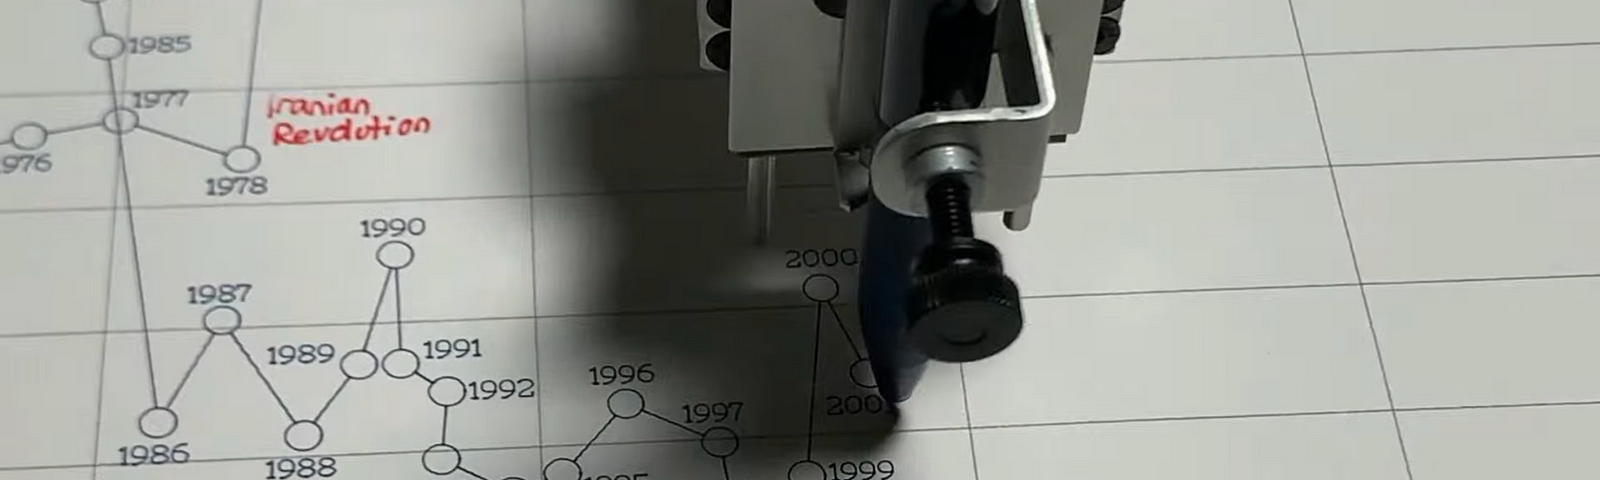
Pen Plotters Are the Perfect Tool for Data Storytelling
The once-defunct tool combines the humanity…
Read more…
405
3 responses
Alexandre Morin-Chassé
in
Nightingale
May 1, 2020
The Stellar Chart: An Elegant Alternative to Radar Charts
What would you do if you were asked to replace existing radar charts with something better?
Read more…
400
4 responses
Isaac Levy-Rubinett
in
Nightingale
Apr 24, 2020
For Your Consideration: Parks & Visualization
One hundred years of visual history and graphic design…
Read more…
72
Jason Forrest
in
Nightingale
Mar 11, 2020
Lessons of Isotype — PART 3
Exploring Isotype Charts: “Our Two Democracies At Work”
Read more…
248
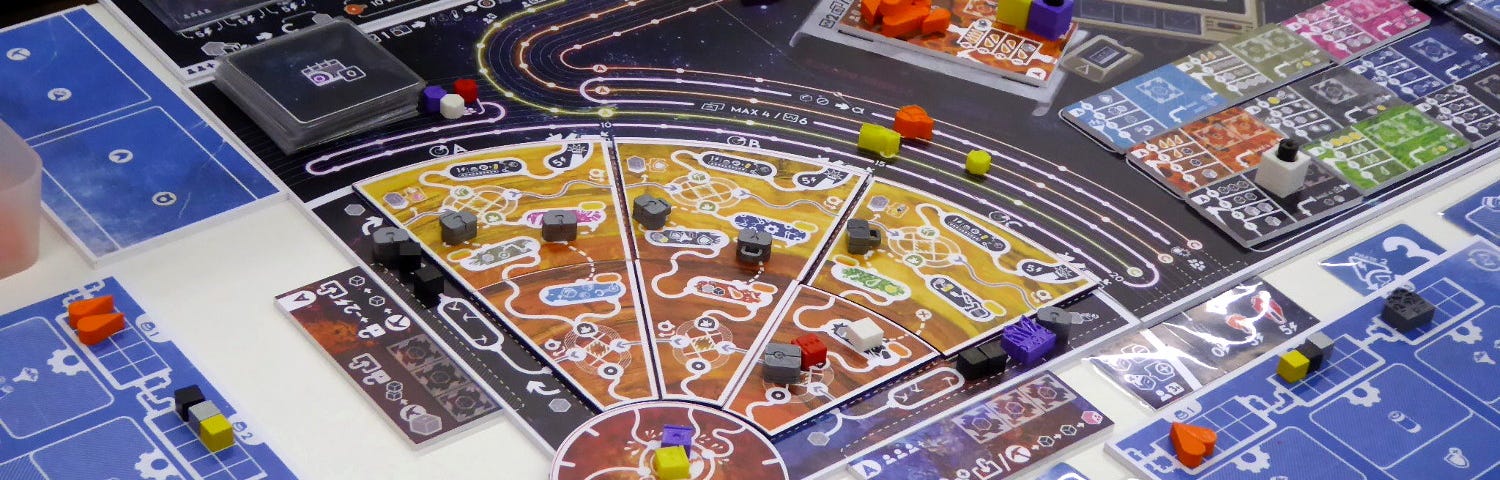
Johannes Wirges
in
Nightingale
Dec 9, 2019
What Board Games Teach Us About Data Visualization
Players spend hours and hours poring over the…
Read more…
516
4 responses