Homepage
Open in app
Sign in
Get started
All stories
How To & Career
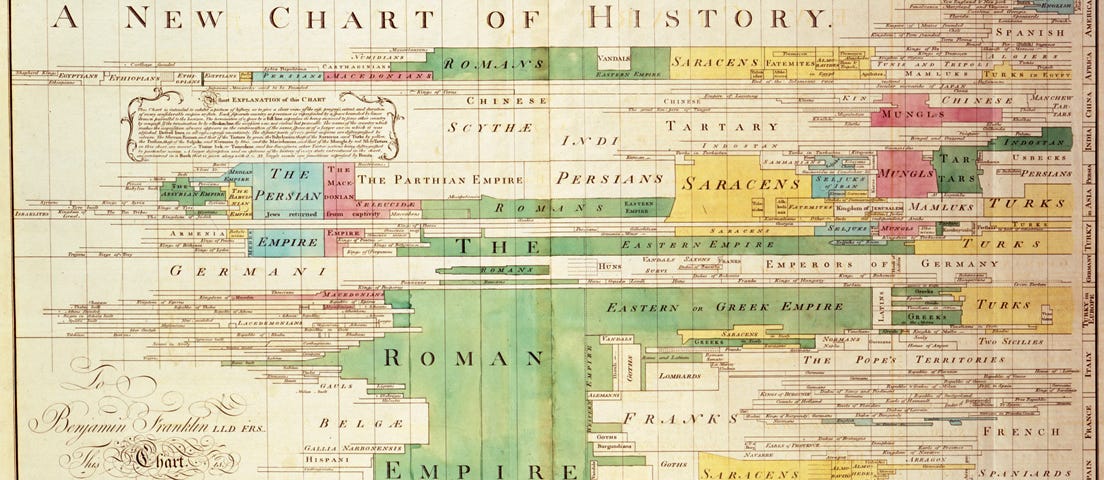
Historic Data Viz
We moved to: https://nightingaledvs.com
Tagged in
How To
Nightingale
We moved to
https://nightingaledvs.com
!
More information
Followers
16.6K
Elsewhere
More, on Medium
How To
Shachee Swadia
in
Nightingale
May 18, 2021
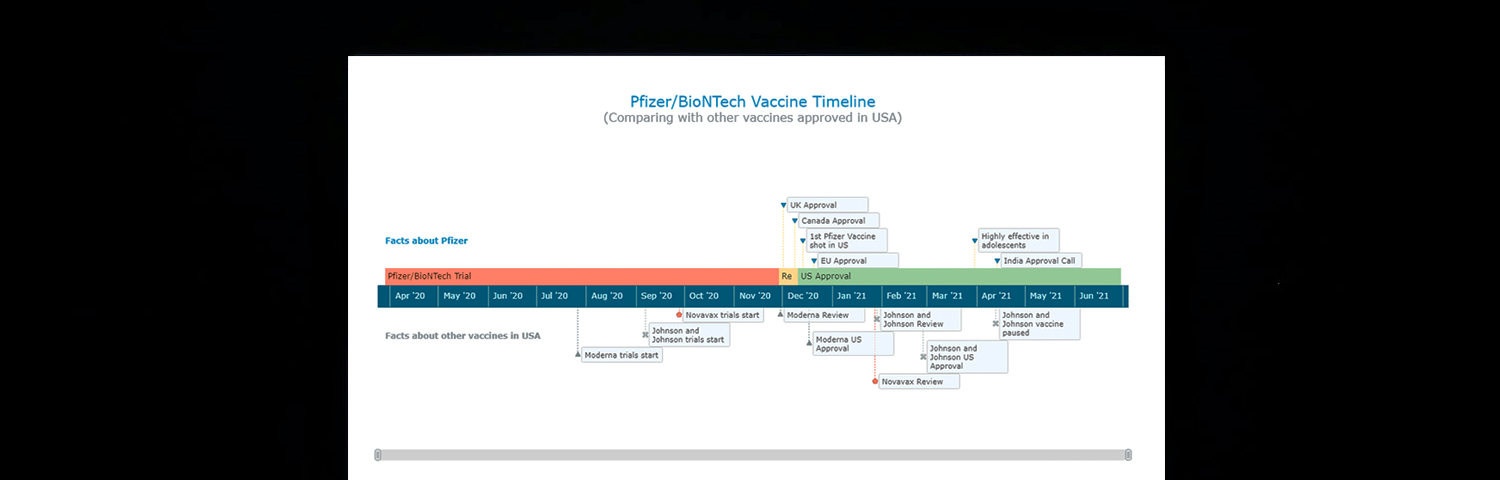
Creating Interactive Timelines with JavaScript
A step-by-step guide to visualizing the development of…
Read more…
710
2 responses
Brian Sedaca
in
Nightingale
Apr 22, 2021
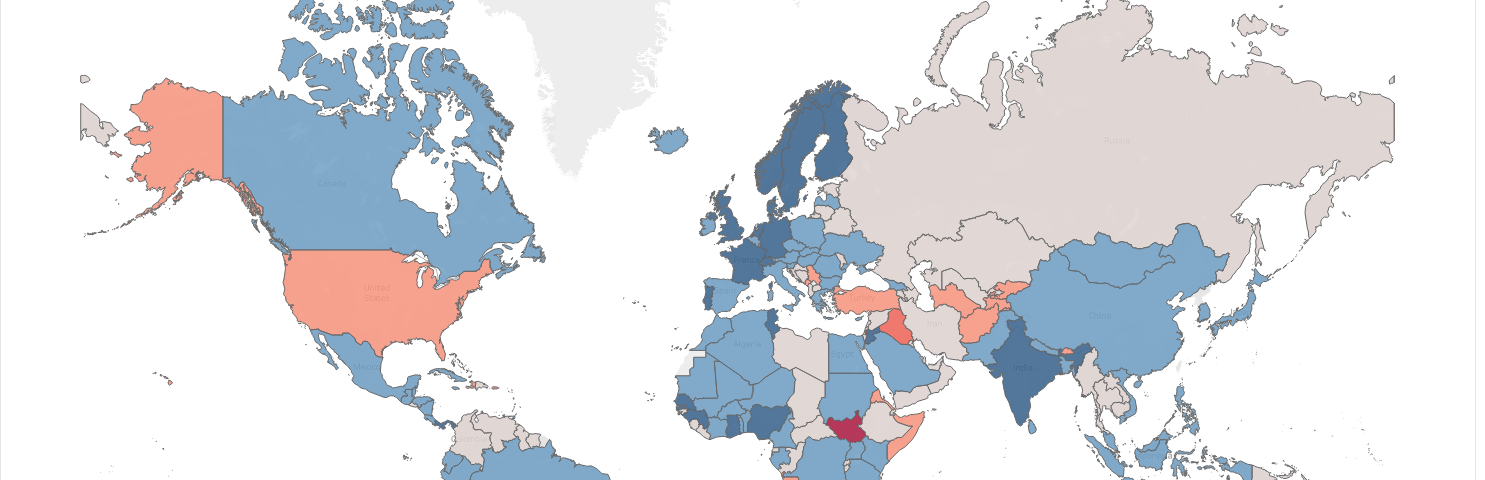
Visualizing Environmental Action
How I visualized United Nations data on environmental treaties
Read more…
303
7 responses
Lilach Manheim
in
Nightingale
Apr 21, 2021
The Most Important Role You’re Not Hiring for Your Data Team: The Information Architect
Read more…
477
7 responses
Erica Gunn
in
Nightingale
Apr 13, 2021
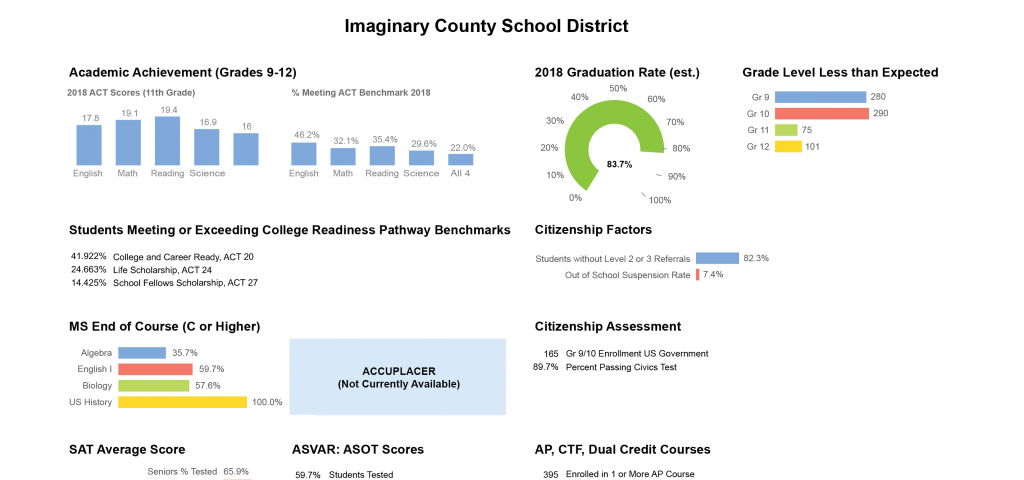
Dashboard Redesign: A Look at Chart Choices
Applying basic design principles, Part 7: Reviewing…
Read more…
119
1 response
Julia Krolik
in
Nightingale
Apr 8, 2021
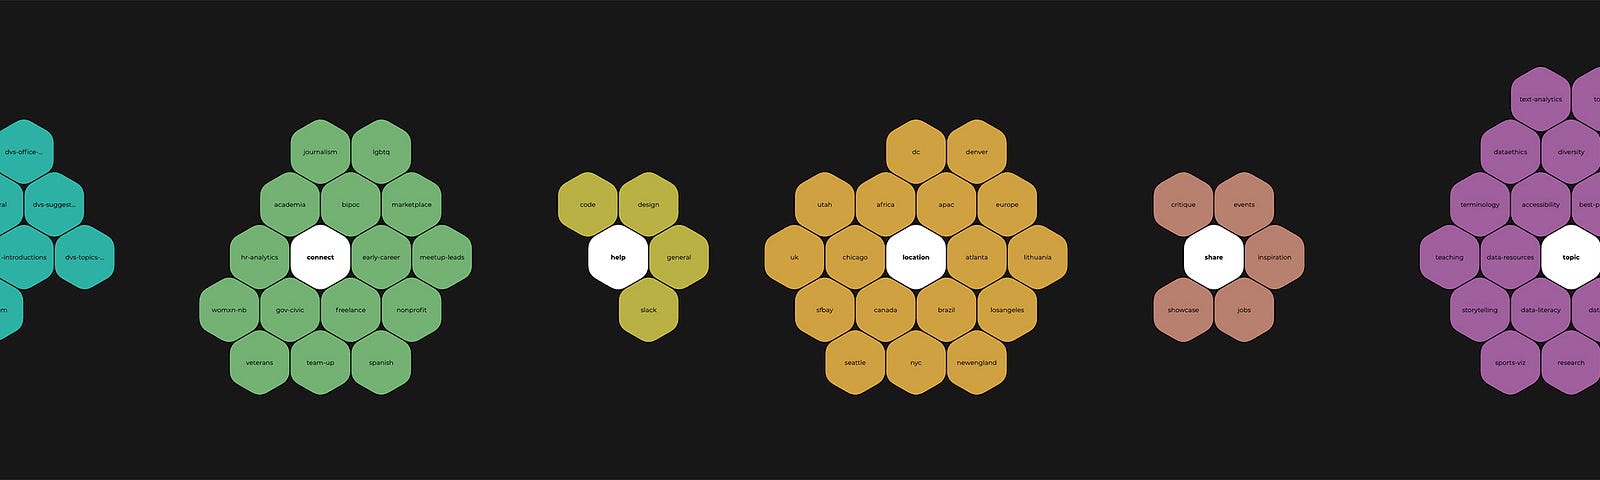
Introducing POLLEN!
How the challenge of navigating DVS’s Slack channels inspired a novel Slack…
Read more…
159
1 response
Jonathan Dunne
in
Nightingale
Apr 7, 2021
How to Create a Simple, Yet Effective, Line Plot
How to answer the question, “Do I have an obvious…
Read more…
144
3 responses
Theresa-Marie Rhyne
in
Nightingale
Apr 6, 2021
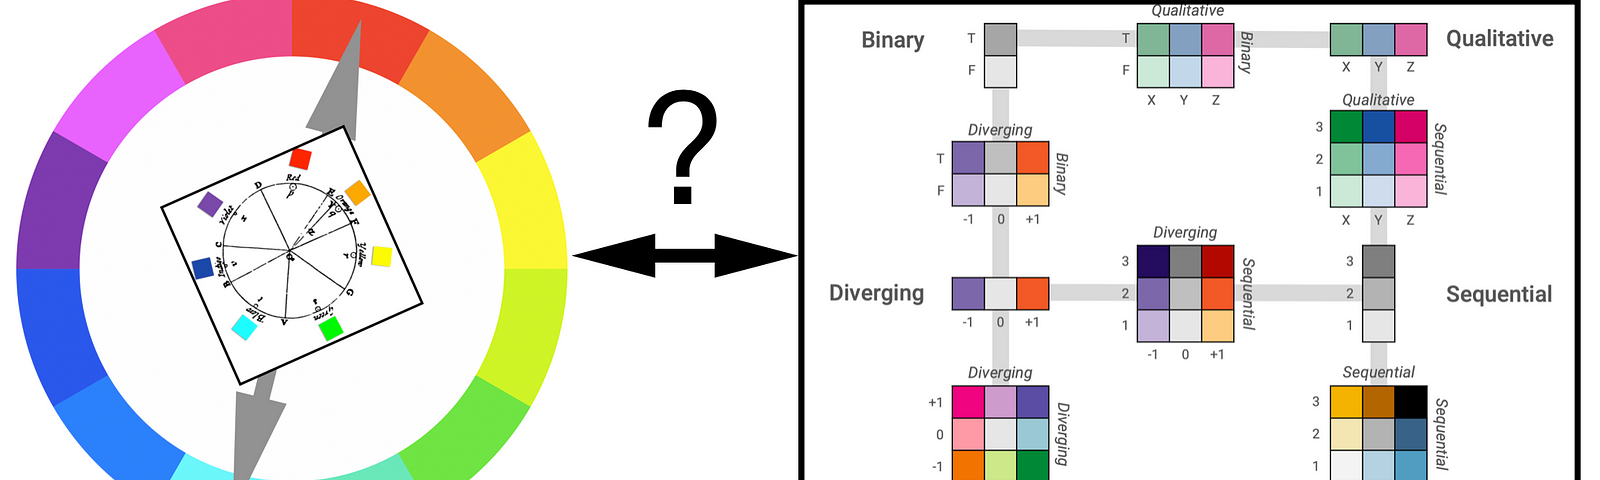
Harmonic Resolution
Translating Color Harmony into Data Color Schemes
Read more…
253
Edwin Zainudin
in
Nightingale
Mar 31, 2021
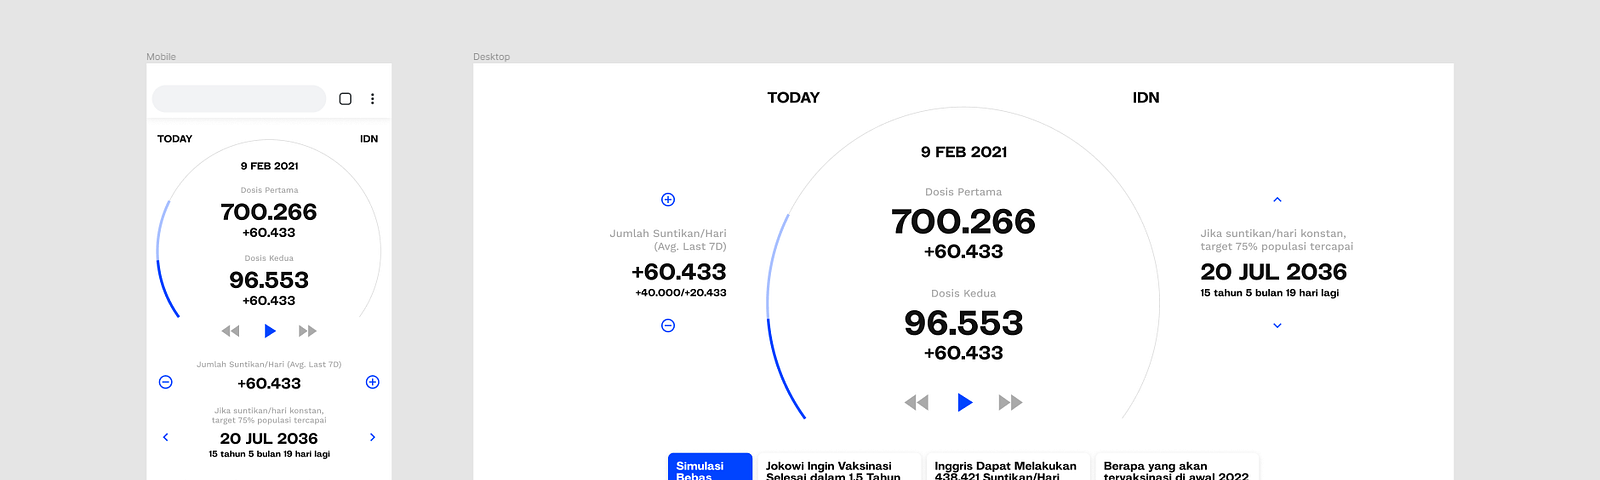
Bloomberg Says > 10 Years, but How Many Years Is It Actually?
Reverse engineering the estimation and…
Read more…
116
1 response
Alexis Bernard
in
Nightingale
Mar 18, 2021
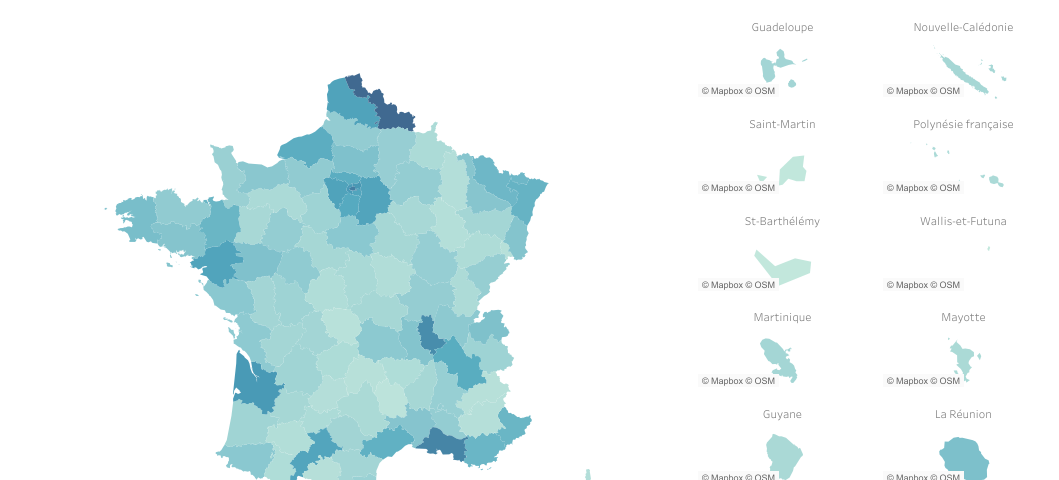
Mapping Overseas France with Tableau
A primer on making granular country maps inclusive of overseas…
Read more…
62
1 response
Simone B
in
Nightingale
Mar 17, 2021
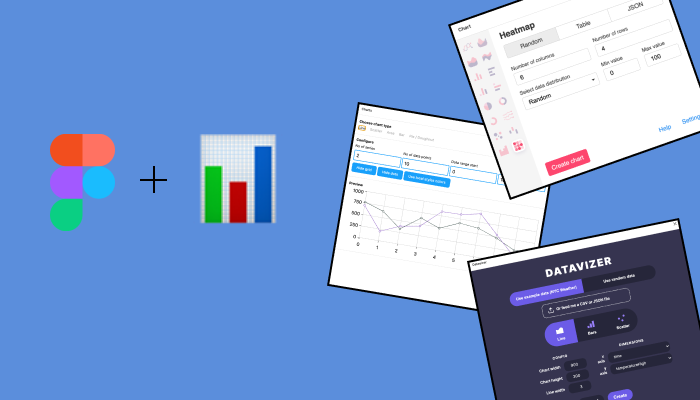
Exploring Chart Plugins in Figma
How to avoid losing hours with the pen tool
Read more…
143
1 response