Homepage
Open in app
Sign in
Get started
All stories
How To & Career
Historic Data Viz
We moved to: https://nightingaledvs.com
Tagged in
Infographics
Nightingale
We moved to
https://nightingaledvs.com
!
More information
Followers
16.6K
Elsewhere
More, on Medium
Infographics
Mala Deep
in
Nightingale
May 19, 2021
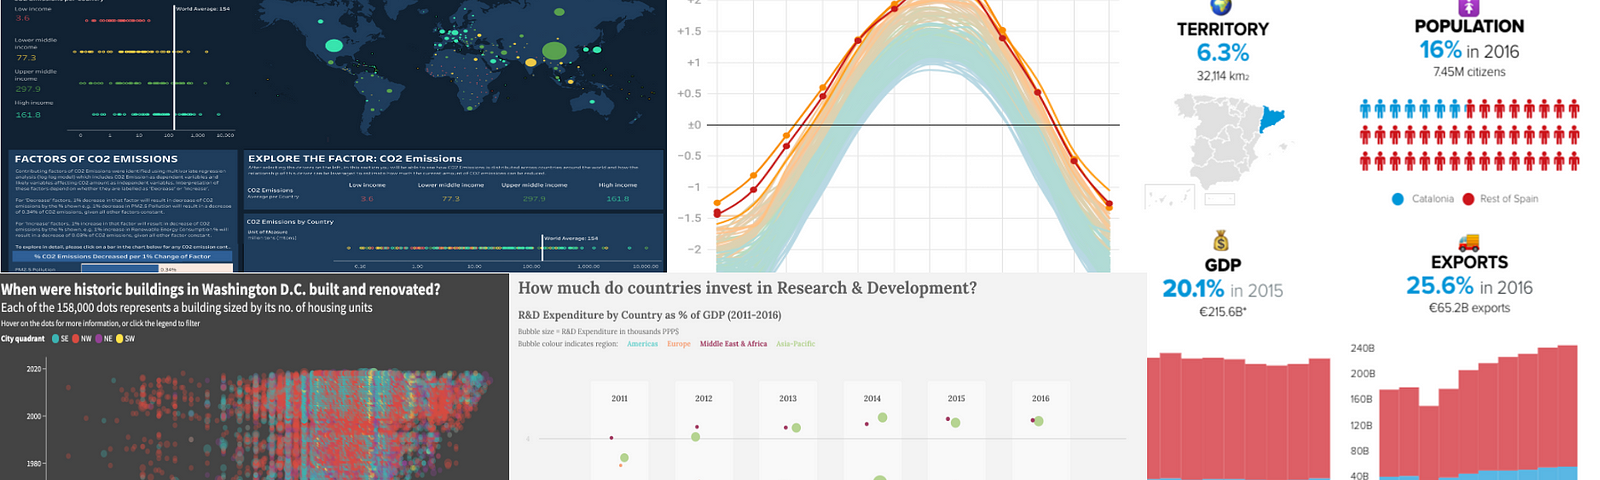
Five Free Data Visualization Tools for Beginners
No intensive coding required
Read more…
828
10 responses
Brian Sedaca
in
Nightingale
Apr 22, 2021
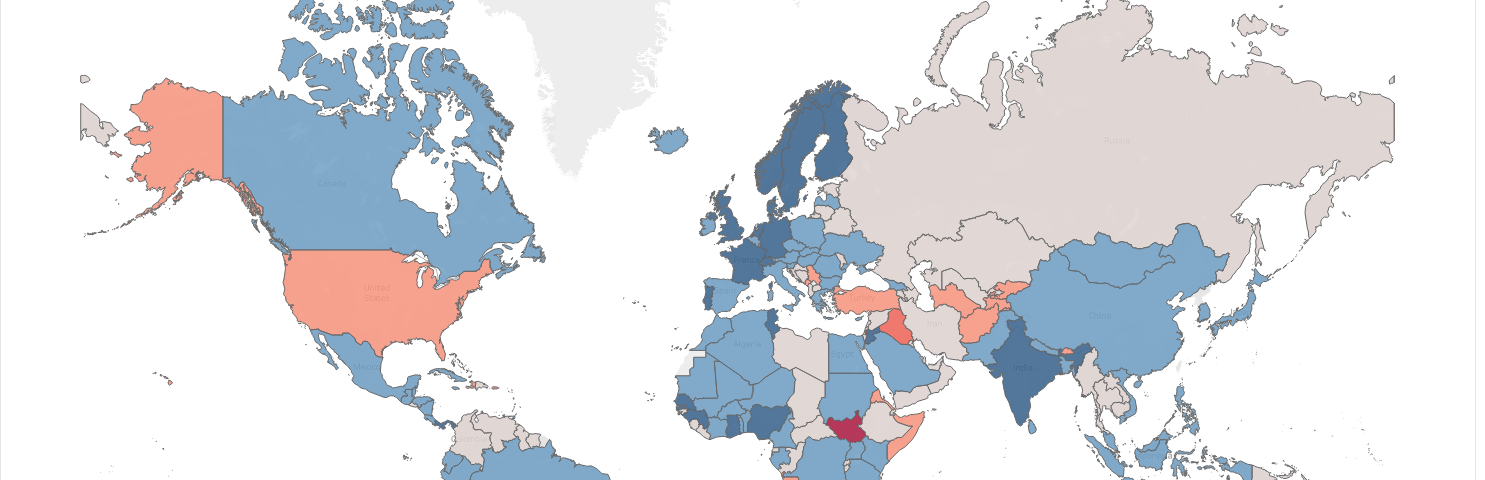
Visualizing Environmental Action
How I visualized United Nations data on environmental treaties
Read more…
303
7 responses
Chesca Kirkland
in
Nightingale
Mar 3, 2021
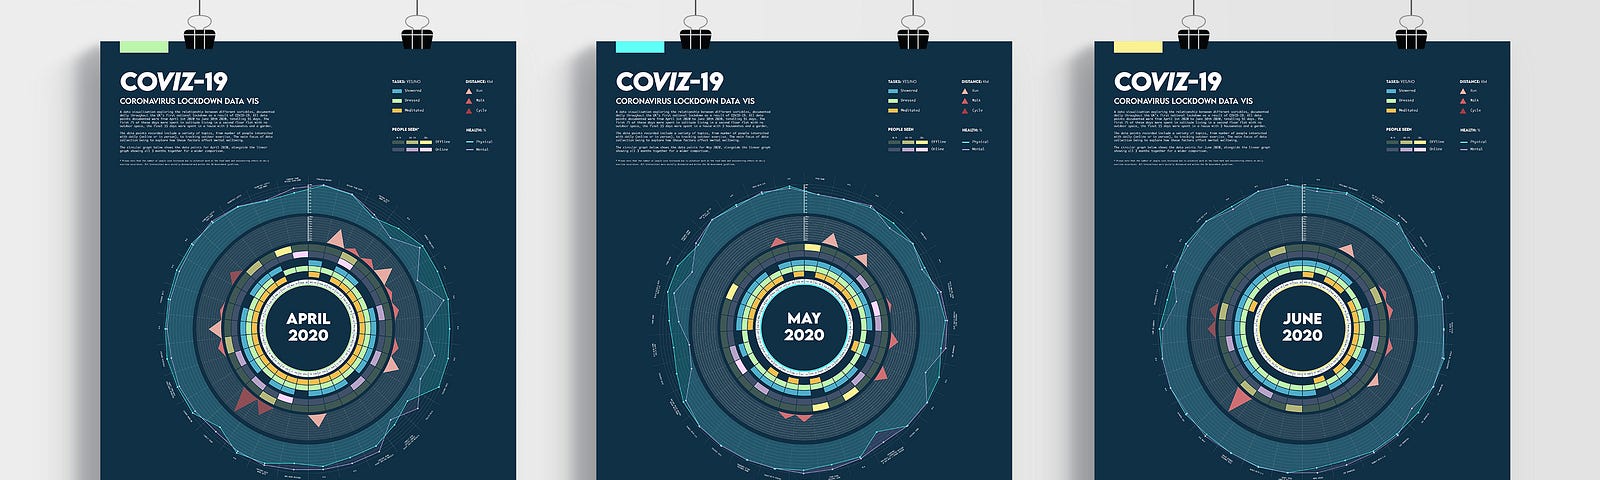
CoViz-19: 10 Things I Learnt from 75 Days Alone in Lockdown
Visualising a historic moment in time
Read more…
940
4 responses
Goof van de Winkel
in
Nightingale
Dec 29, 2020
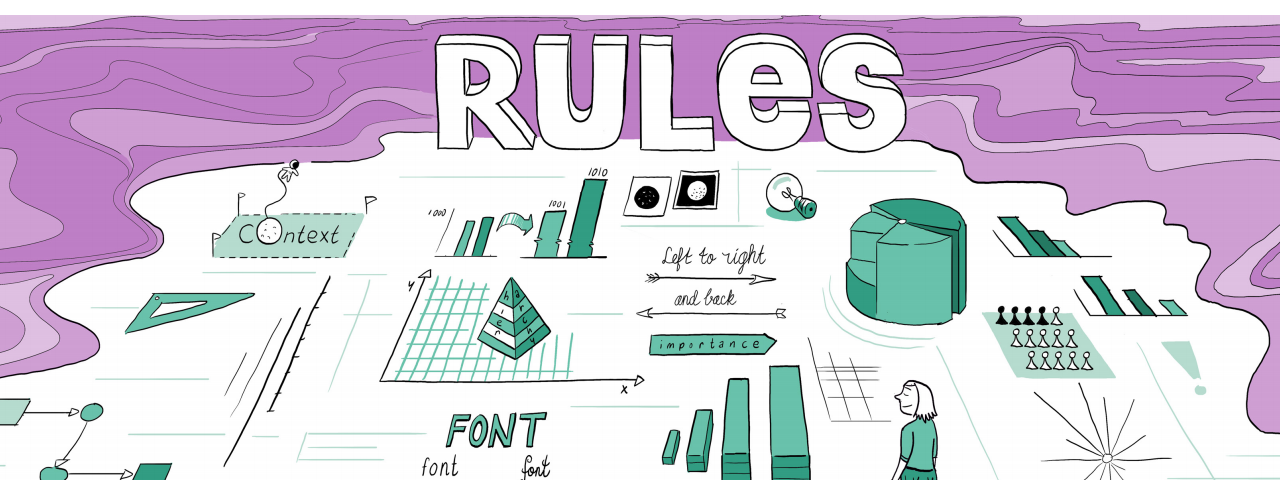
Rules Are Relevant
S-H-O-W conference speakers talk about maintaining the delicate balance between…
Read more…
191
1 response
Maxene Graze
in
Nightingale
Aug 10, 2020
Curating Curiosity: How Data Viz Can Enhance the Museum Experience
Data visualization can level up
…
Read more…
87
1 response
Valentina D'Efilippo
in
Nightingale
Jun 18, 2020
Sketching the World: An Icebreaker to Working With Data
Sketch the world from memory and learn data…
Read more…
410
2 responses
Ryu Sakai
in
Nightingale
Apr 3, 2020
What I Learned From COVID-19 Data Visualization
Read more…
79
Ricardo Cunha Lima
in
Nightingale
Apr 1, 2020
Infographics That Can Help To “Flatten The Curve” of COVID-19
Charts are great, but these two animated
…
Read more…
91
Tricia Aung
in
Nightingale
Apr 13, 2020
Visualizing Coronavirus Impact: An Interview With Reuters Graphics
Read more…
189
1 response
Jason Forrest
in
Nightingale
Apr 10, 2020
Exploring Soviet Isotypes: Digitizing “The Struggle for Five Years in Four”
Documenting the…
Read more…
158
2 responses