Homepage
Open in app
Sign in
Get started
All stories
How To & Career
Historic Data Viz
We moved to: https://nightingaledvs.com
Tagged in
JavaScript
Nightingale
We moved to
https://nightingaledvs.com
!
More information
Followers
16.6K
Elsewhere
More, on Medium
JavaScript
Shachee Swadia
in
Nightingale
May 18, 2021
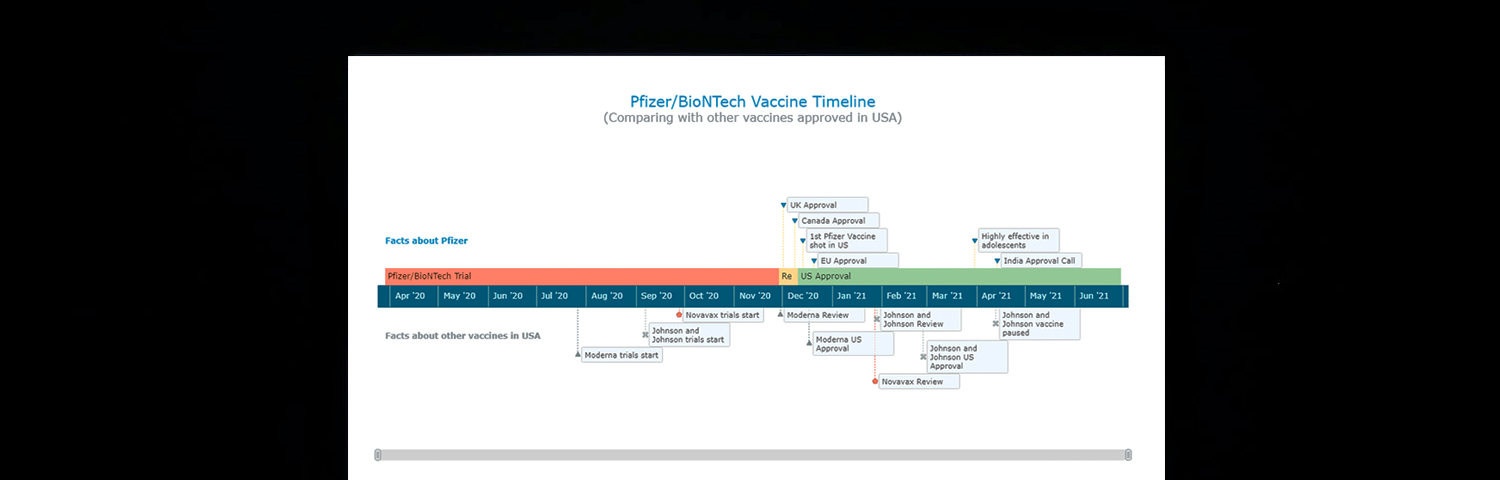
Creating Interactive Timelines with JavaScript
A step-by-step guide to visualizing the development of…
Read more…
710
2 responses
Maxene Graze
in
Nightingale
Jan 13, 2021
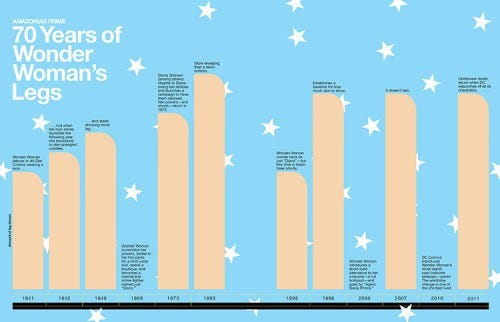
Typescript: D3’s Loyal Sidekick
My roadmap to becoming a D3 Wonder Woman
Read more…
127
4 responses
Abhilash
in
Nightingale
Jan 4, 2021
Do You Still Read Newspapers?
Tracking the circulation of newspapers across States and Union…
Read more…
133
6 responses
Abhilash
in
Nightingale
Jul 14, 2020
What Am I Reading?
Following a legacy of turning everyday activities into data art
Read more…
199
1 response
Christopher DeMartini
in
Nightingale
May 1, 2020
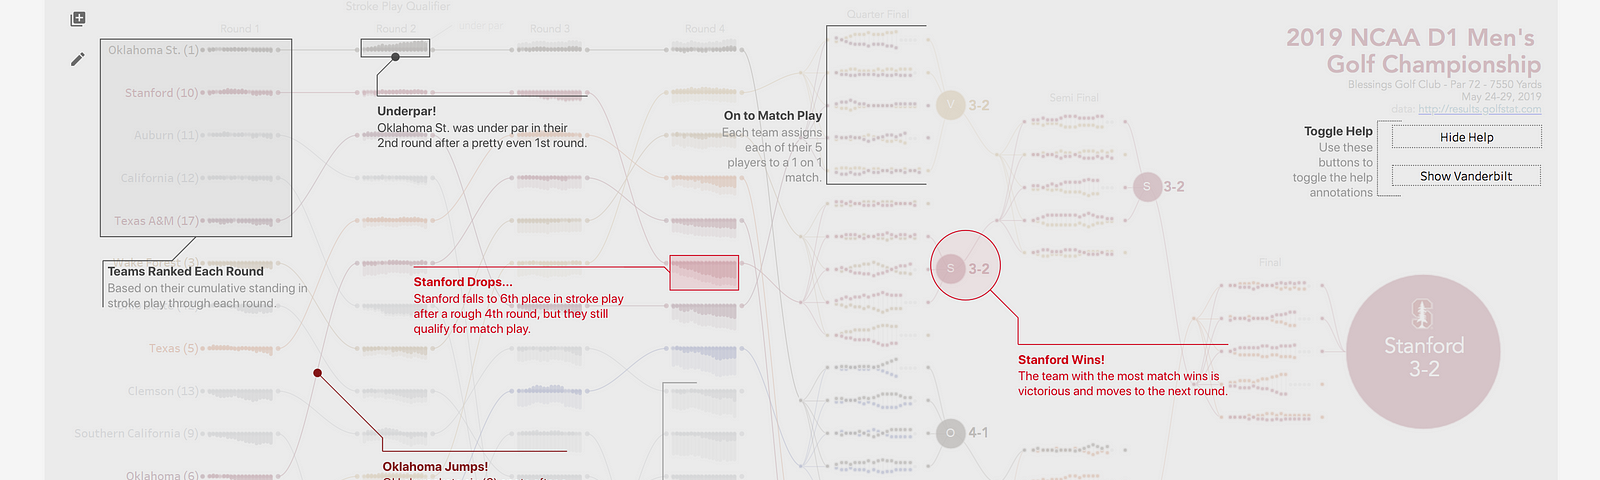
Use the Right Tool for the Job
Take advantage of the convergence and integration of visualization…
Read more…
174
1 response
Ben Dexter Cooley
in
Nightingale
Jan 29, 2020
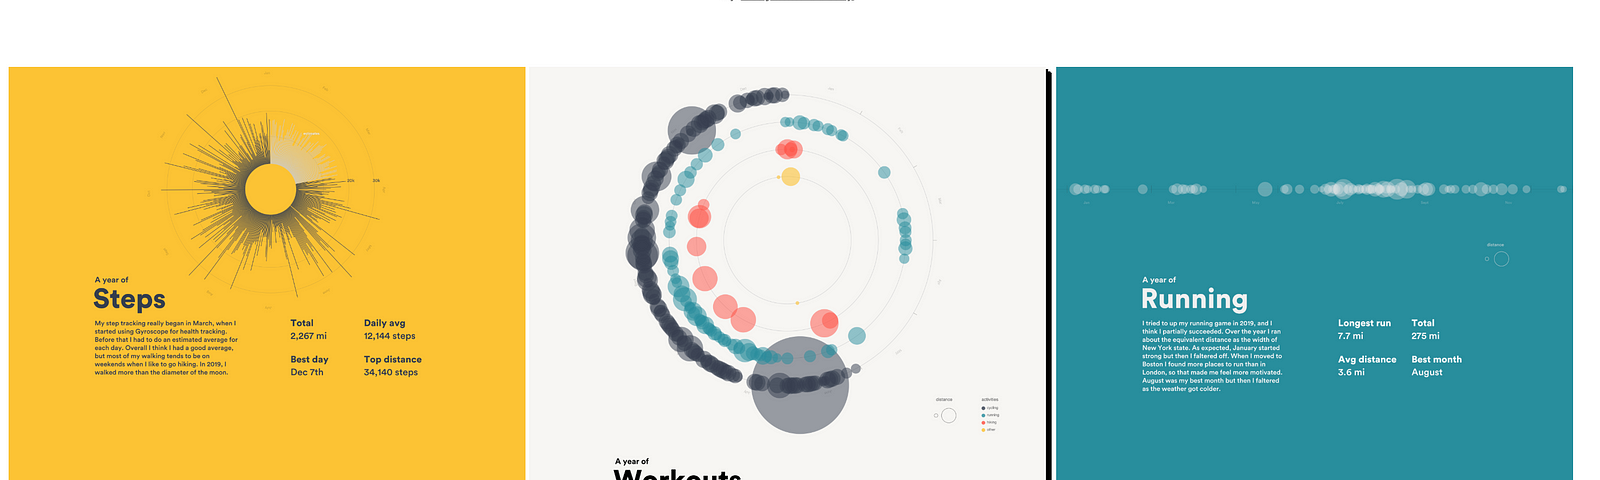
My Year in Data: a Visual Reflection on 2019
I tracked my activities for a year. Then I visualized
…
Read more…
594
3 responses
TZUSHIREAUX
in
Nightingale
Jan 17, 2020
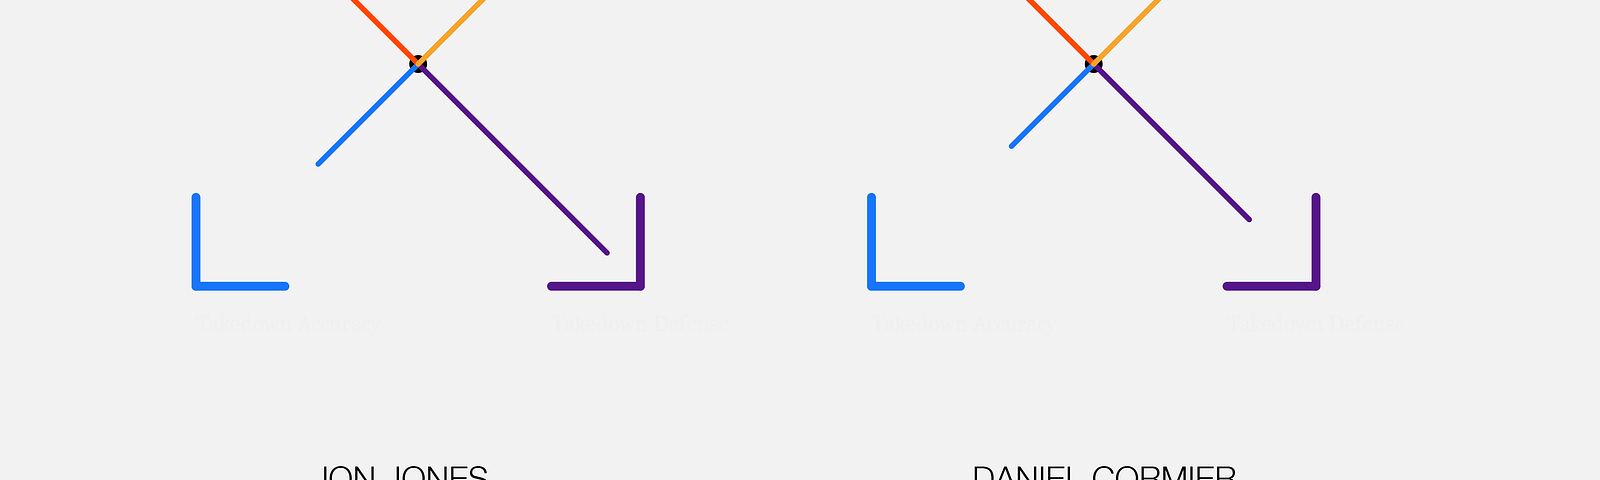
A New Way to plot UFC Fighter Data using p5.js
I started doing some tutorials on p5.js, and I wanted…
Read more…
81
Marina Silivestru
in
Nightingale
Jan 15, 2020
Structuring My Path to Custom Components
A step-by-step guide through the process of designing bespoke elements
Read more…
154
Phil Hawkins
in
Nightingale
Nov 8, 2019
So You Want To Pick A Dataviz Platform: Part II- Python (& Friends)
Told From the Perspective of…
Read more…
185
Dave O'Donovan
in
Nightingale
Oct 21, 2019
D3 and React — A Design Pattern for Responsive Charts Part 3
Part III: Reusable Modules.
Read more…
162
1 response