Homepage
Open in app
Sign in
Get started
All stories
How To & Career
Historic Data Viz
We moved to: https://nightingaledvs.com
Tagged in
Tableau
Nightingale
We moved to
https://nightingaledvs.com
!
More information
Followers
16.6K
Elsewhere
More, on Medium
Tableau
Mala Deep
in
Nightingale
May 19, 2021
Five Free Data Visualization Tools for Beginners
No intensive coding required
Read more…
828
10 responses
Brian Sedaca
in
Nightingale
Apr 22, 2021
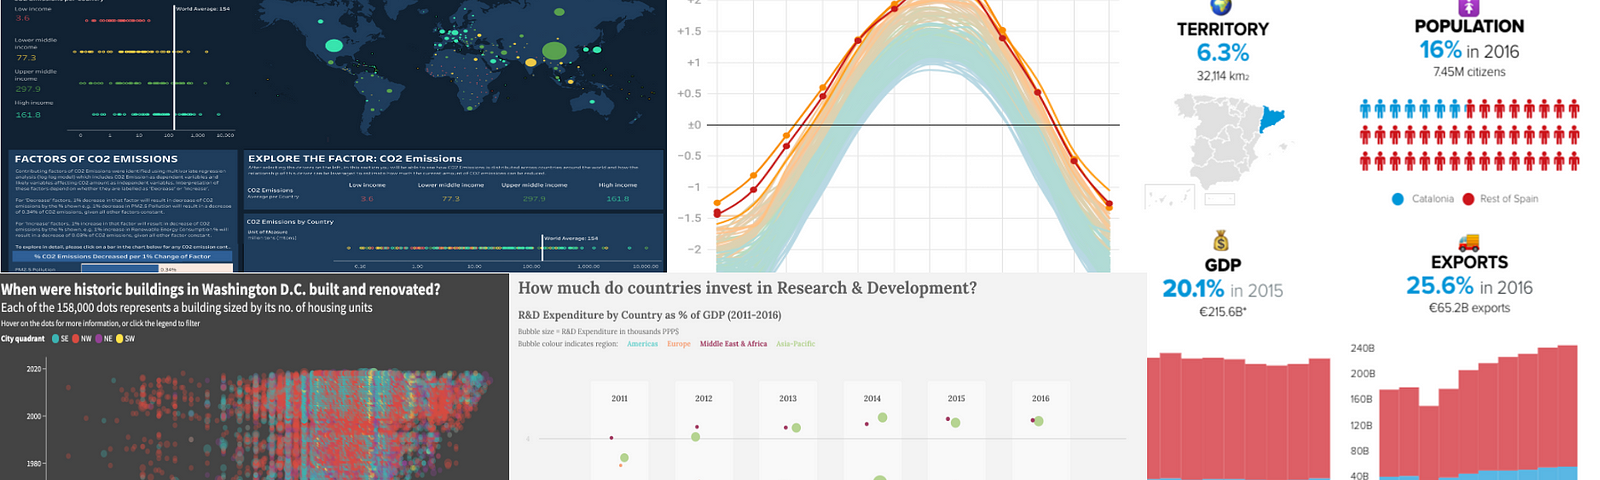
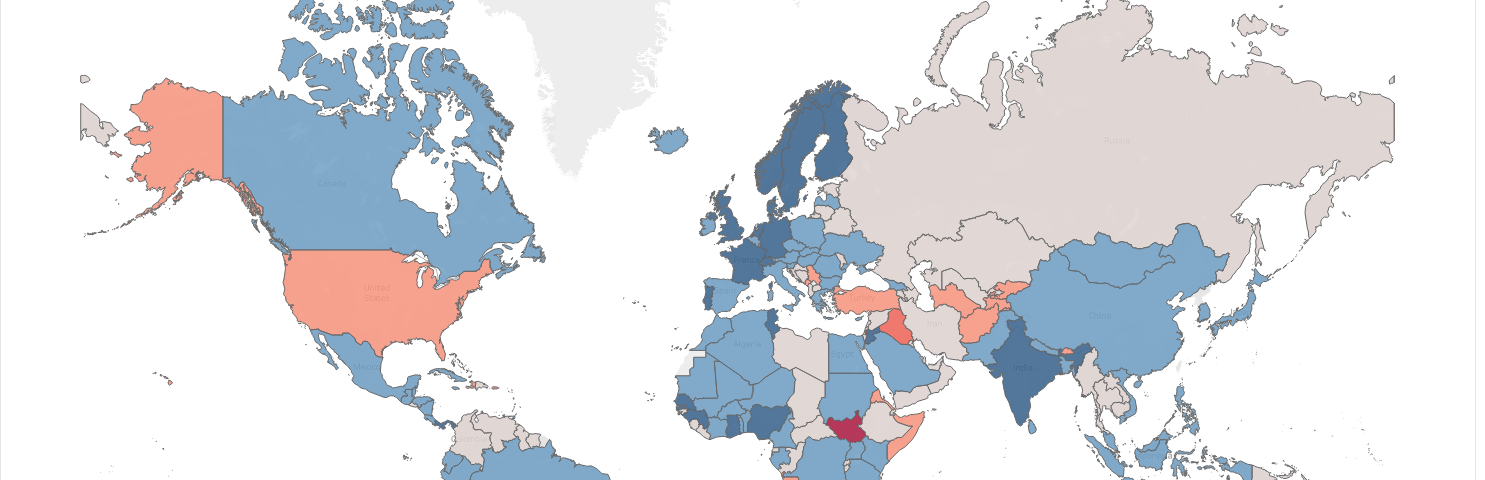
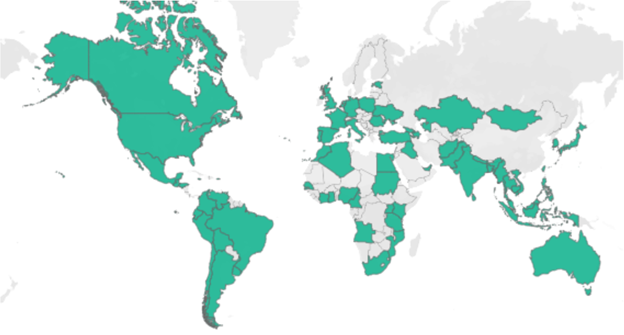
Visualizing Environmental Action
How I visualized United Nations data on environmental treaties
Read more…
303
7 responses
Chuck Utterback
in
Nightingale
Feb 24, 2021
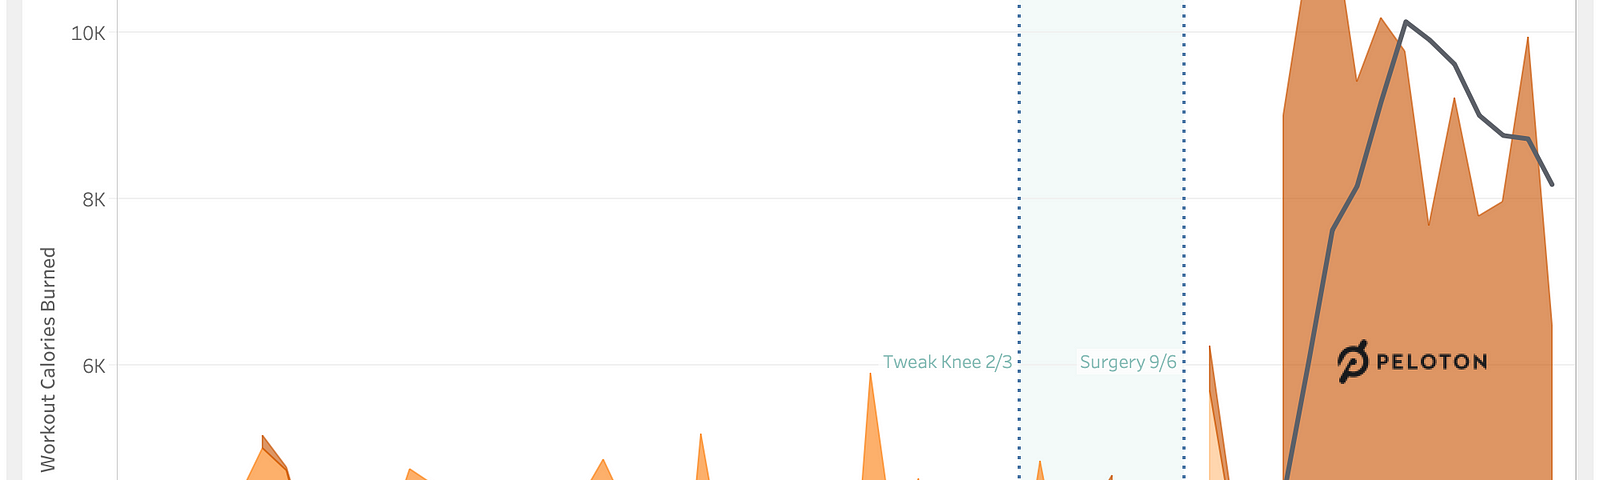
How Peloton Drove a 149% Increase in My Workouts
A visual story of how the cycle is saving my knees
Read more…
197
3 responses
Katie Kilroy
in
Nightingale
Feb 12, 2021
What is Data Scaffolding?
How to create your own supportive framework to facilitate more thorough…
Read more…
136
2 responses
Jenna Eagleson
in
Nightingale
Nov 20, 2020
Is Tableau Really Better Than Power BI?
Reactions to using Tableau for the first time; from a Power BI user.
Read more…
242
10 responses
Amanda Makulec
in
Nightingale
Nov 10, 2020
Enabling Data-Led Communications about Preventing the Spread of COVID-19
Exploring knowledge…
Read more…
84
1 response
Alex Kolokolov
in
Nightingale
Sep 28, 2020
Striking the Right Balance Between Creativity and Clarity
The two aren’t inherently at odds with…
Read more…
1.5K
4 responses
Jenna Eagleson
in
Nightingale
Sep 8, 2020
Three Dynamic Texts to Include in Every Dashboard
Read more…
324
4 responses
Alex Kolokolov
in
Nightingale
Aug 18, 2020
In Pursuit of a New Golden Ratio
Examining a visualization of safety at Ivy League Universities to…
Read more…
1.2K
1 response
Tomas Dvorak
in
Nightingale
Jul 9, 2020
Visualizing the Collapse in Traffic Collisions During Stay-at-Home Orders
And how traffic data impacts excess deaths, one proxy for COVID-19 mortality
Read more…
127
1 response