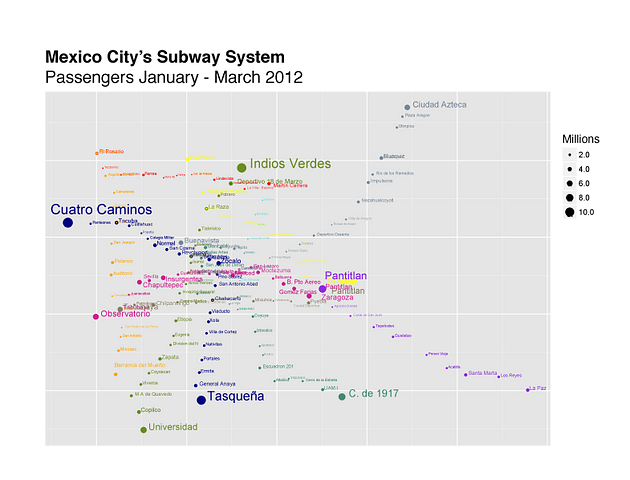
I used R and ggplot2 to make a bubble map of Mexico City’s Metro passenger count from January to February…