Homepage
Open in app
Sign in
Get started
🎉product updates
📊graphs + charts
📝the dish on data
📚learn more
Tagged in
D3js
Plotly
Plotly is a data visualization company that makes it easy to build, test, and deploy beautiful interactive web apps, charts and graphs—in any programming language.
More information
Followers
3.8K
Elsewhere
More, on Medium
D3js
Plotly
in
Plotly
Jun 21, 2017
🌟 Introducing Dash 🌟
Create Reactive Web Apps in pure Python
Read more…
7.3K
22 responses
Plotly
in
Plotly
Sep 18, 2017
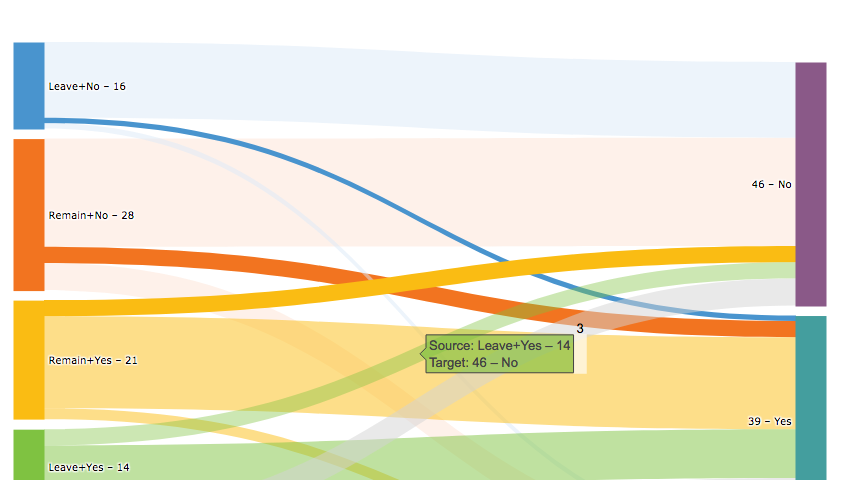
4 interactive Sankey diagrams made in Python
Plotly has a new member of the Plotly.js chart family: The Sankey diagram. Allow…
Read more…
772
3 responses
Plotly
in
Plotly
Oct 31, 2017
Assessing Global Health, One 📈 at a Time
The Institute for Health Metrics and Evaluation website is…
Read more…
36
Plotly
in
Plotly
May 1, 2018
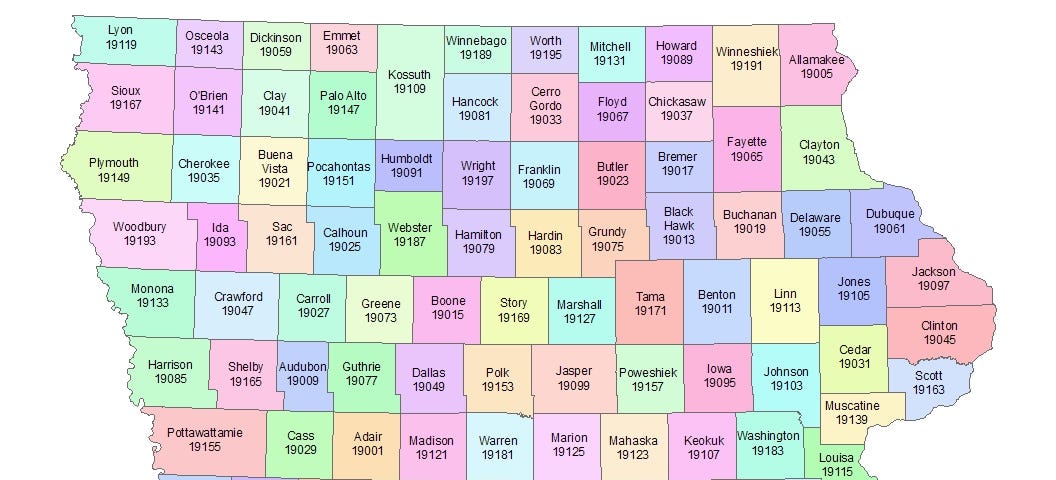
What is a FIPS code? County-level charts in Python
Large datasets that are organized by FIPS county…
Read more…
52
2 responses