You can observe the data either within our cloud GIS application, Geopedia, or through your favorite GIS application (e.g. QGis, ArcGIS, OpenLayers or others) using WMS.
For efficient analysis of the Sentinel-2 data, users do not want to worry about concepts such as “product”, “granule”…
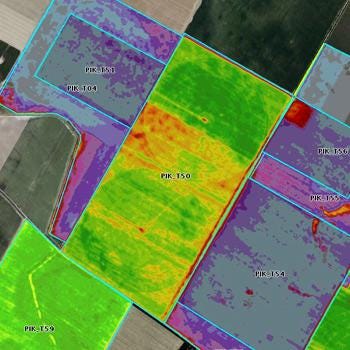
For an image like Europe below, for example, to generate manually it would require the download of 60+ products/tiles taking up about 40GB of data. This data would then need to be uncompressed, processed, projected and then merged before yielding the desired image, not such an easy…