Homepage
Open in app
Sign in
Get started
Tagged in
Data Visualization
Syncfusion
Syncfusion provides third-party UI components for React, Vue, Angular, JavaScript, Blazor, .NET MAUI, ASP.NET MVC, Core, WinForms, WPF, UWP and Xamarin.
More information
Followers
344
Elsewhere
More, on Medium
Data Visualization
Jollen Moyani
in
Syncfusion
Jun 26
Chart of the Week: Creating a .NET MAUI Doughnut Chart to Visualize the World’s Biggest Oil Producers
Read more…
Christopher Issac Sunder K.
in
Syncfusion
Jun 12
Chart of the Week: Creating a WPF Pie Chart to Visualize the Percentage of Global Forest Area for Each Country
Read more…
Jollen Moyani
in
Syncfusion
May 1
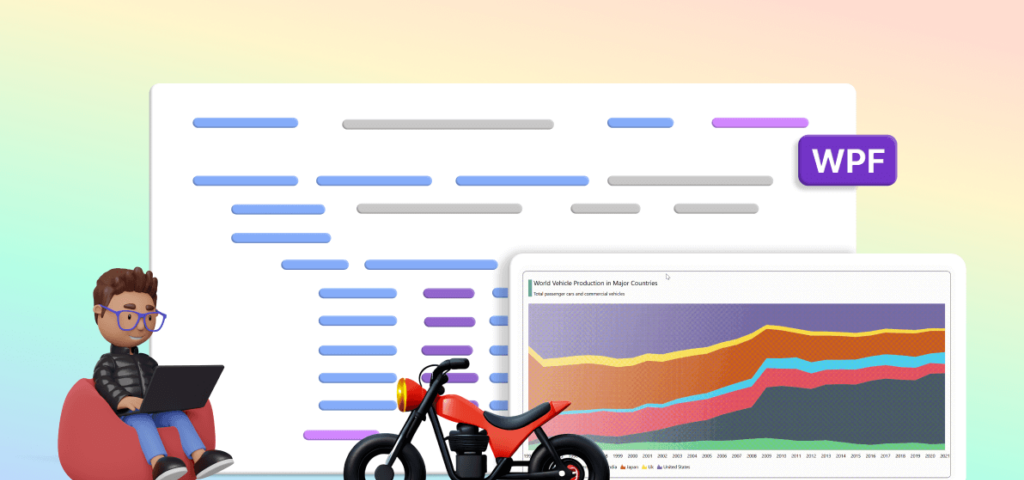
Chart of the Week: Creating a WPF 100% Stacked Area Chart to Visualize the World Vehicle Production in Major…
Read more…
Jollen Moyani
in
Syncfusion
Apr 24
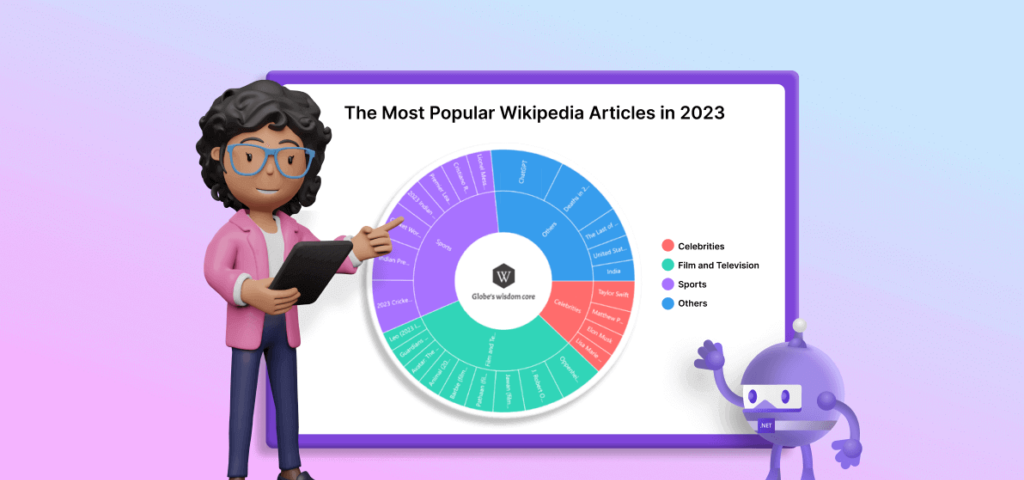
Chart of the Week: Creating a .NET MAUI Sunburst Chart to Visualize the Most Popular Wikipedia Articles
Read more…
Jollen Moyani
in
Syncfusion
Apr 17
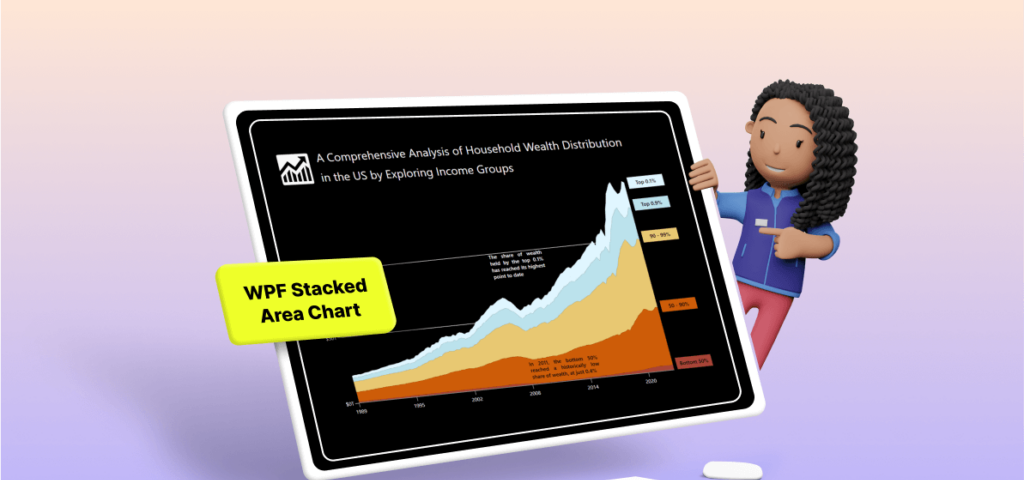
Chart of the Week: Creating a WPF Stacked Area Chart to Visualize Wealth Distribution in the U.S.
Read more…
Gayathri Ramalingam
in
Syncfusion
Apr 3
Unveiling the New Angular 3D Circular Charts Component
Read more…
Gayathri Ramalingam
in
Syncfusion
Apr 3
Chart of the week: Creating a WPF 3D Column Chart to Visualize the Panama Canal’s Shipment Transit Data
Read more…
Jollen Moyani
in
Syncfusion
Mar 13
Chart of the Week: Creating a WPF Chart Dashboard to Visualize the 2023 World Billionaires List
Read more…
Jollen Moyani
in
Syncfusion
Mar 6
Chart of the Week: Create a .NET MAUI Column Chart to Visualize which Milk Is the Most Sustainable
Read more…
Jollen Moyani
in
Syncfusion
Feb 21
Chart of the Week: Creating a WPF Bar Chart to Visualize the Homelands of America’s International Students
Read more…
1