Homepage
Open in app
Sign in
Get started
Tagged in
Data Science
Colourful Facts
Explorations in the field of journalism, data visualisation and content creation. Email at:
thomas@colourfulfacts.com
More information
Followers
58
Elsewhere
More, on Medium
Data Science
Thomas de Beus
in
Colourful Facts
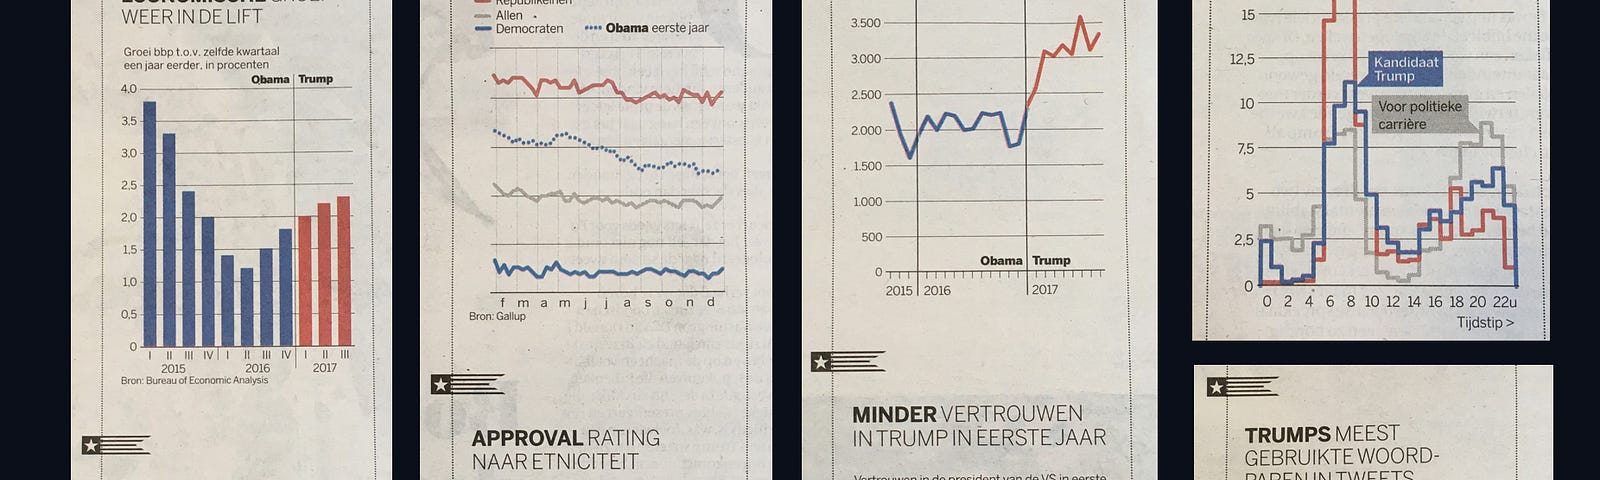
Feb 2, 2018
A graphics reporting project: Why R was my saviour and Excel was not
Read more…
45
Thomas de Beus
in
Colourful Facts
Jan 8, 2018
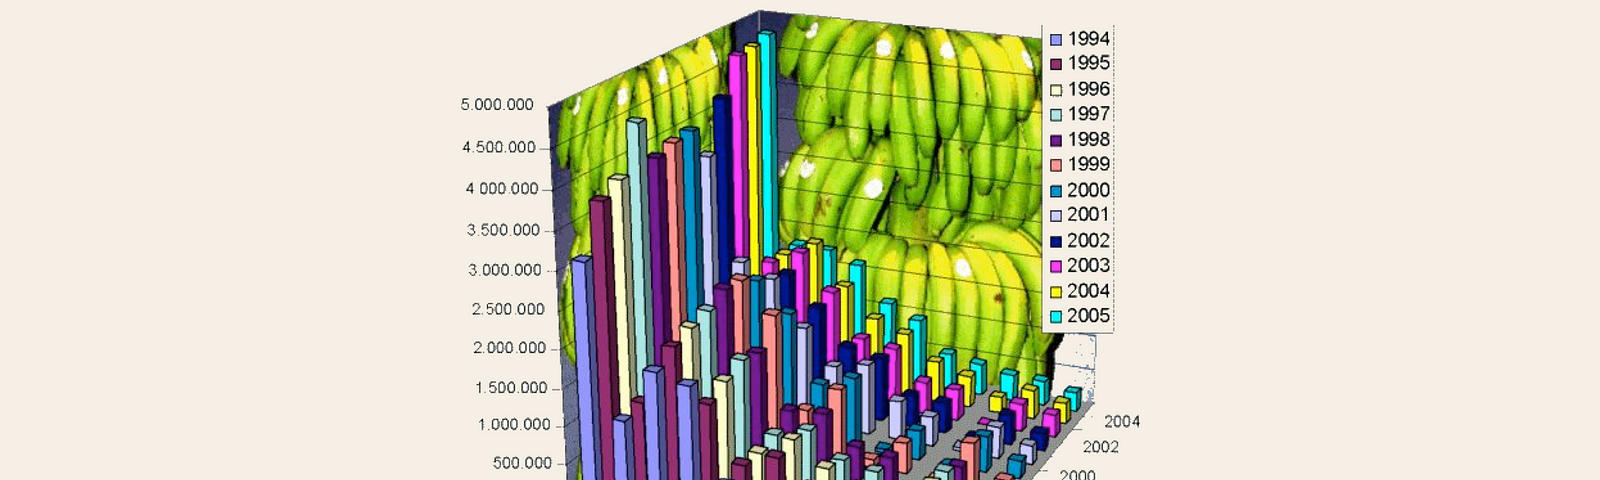
Redesign of a truly bananas chart
On Twitter, I stumbled upon this horrendous 3D bar chart. When looking at the data, it might have…
Read more…
4
Thomas de Beus
in
Colourful Facts
Jul 16, 2017
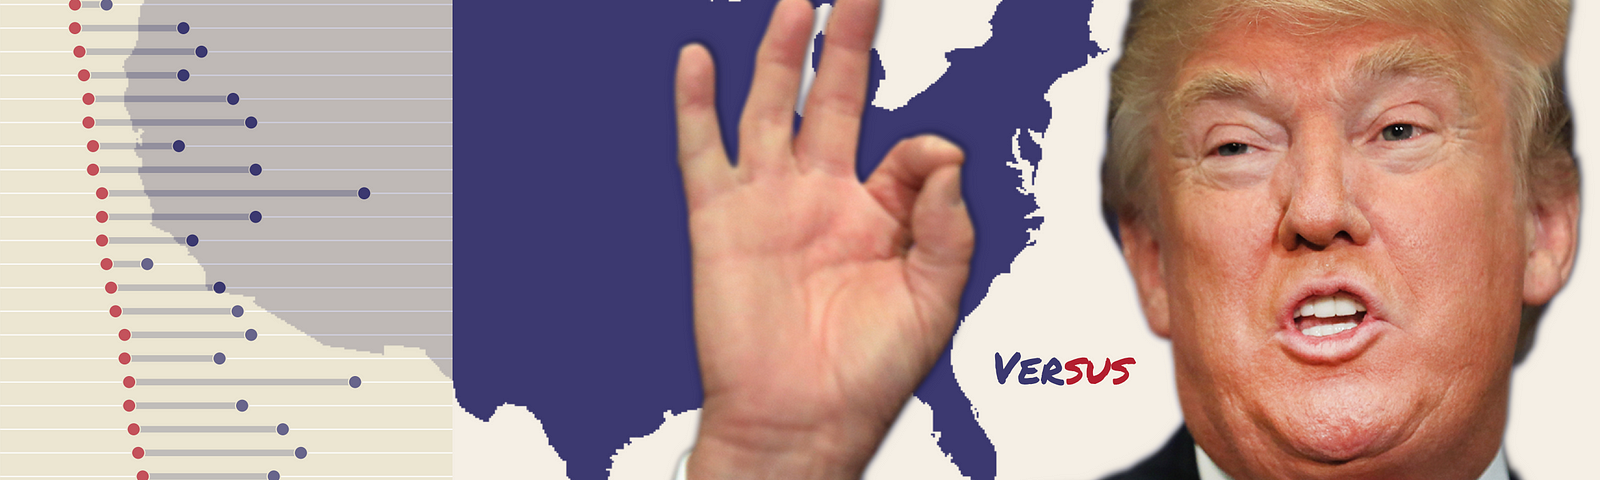
How the world sees the U.S.A. after Trump’s inauguration
Read more…
6
Thomas de Beus
in
Colourful Facts
May 30, 2017
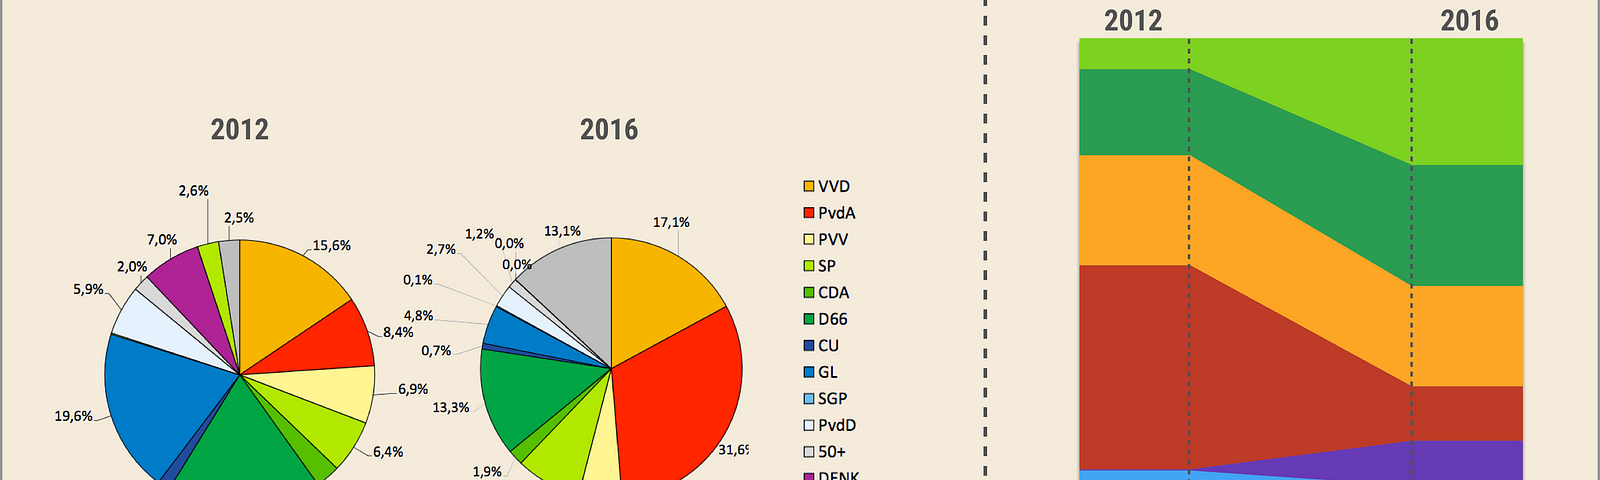
Dutch elections results, worst election chart ever
Read more…
Thomas de Beus
in
Colourful Facts
May 30, 2017
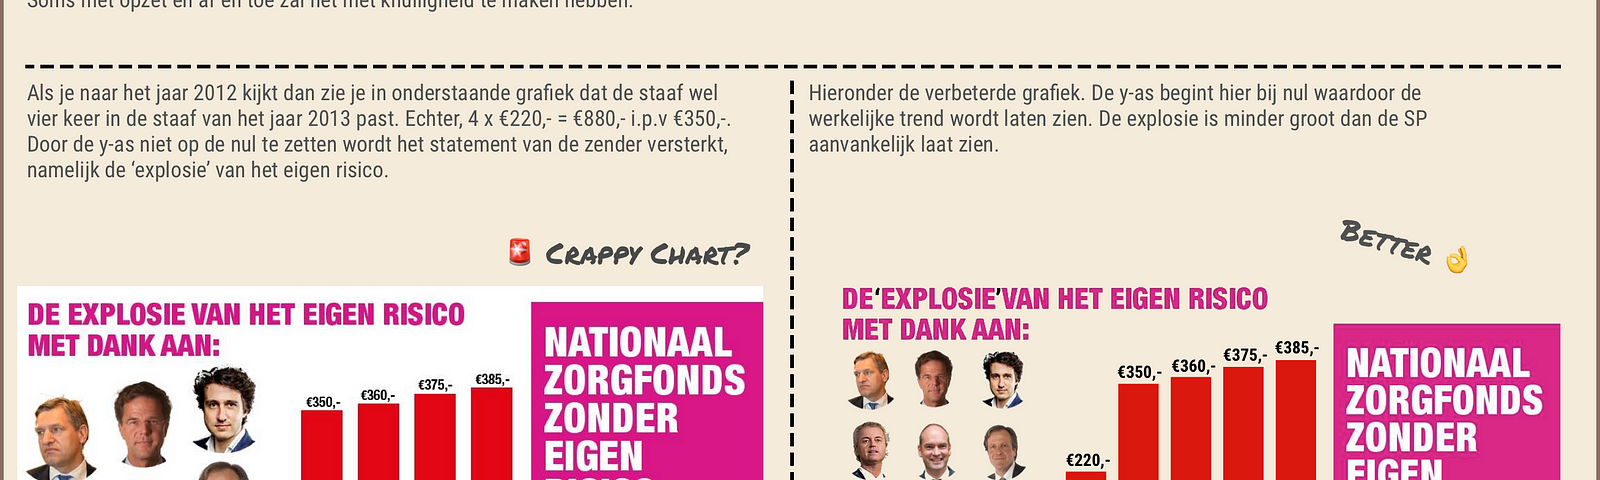
Socialist Party (SP) lies with graph in advance to elections
Read more…
2
Thomas de Beus
in
Colourful Facts
Mar 24, 2017
Think About the Grammar of Graphics When Improving Your Graphs
Read more…
104
1 response