Homepage
Open in app
Sign in
Get started
The Stata Guide
Welcome
Stata tips
LaTeX
Maps
Workflow
Programming
Blog
Tagged in
Covid-19
The Stata Guide
Here we showcase a series of articles on the Stata software covering topics ranging from data science to statistical analysis.
More information
Followers
1.1K
Elsewhere
More, on Medium
Covid-19
Fahad Mirza
in
The Stata Guide
Jun 14, 2021
Stata Graph Replication: The Economist’s Covid-19 Excess Death visualization
Read more…
26
1 response
Asjad Naqvi
in
The Stata Guide
Dec 9, 2020
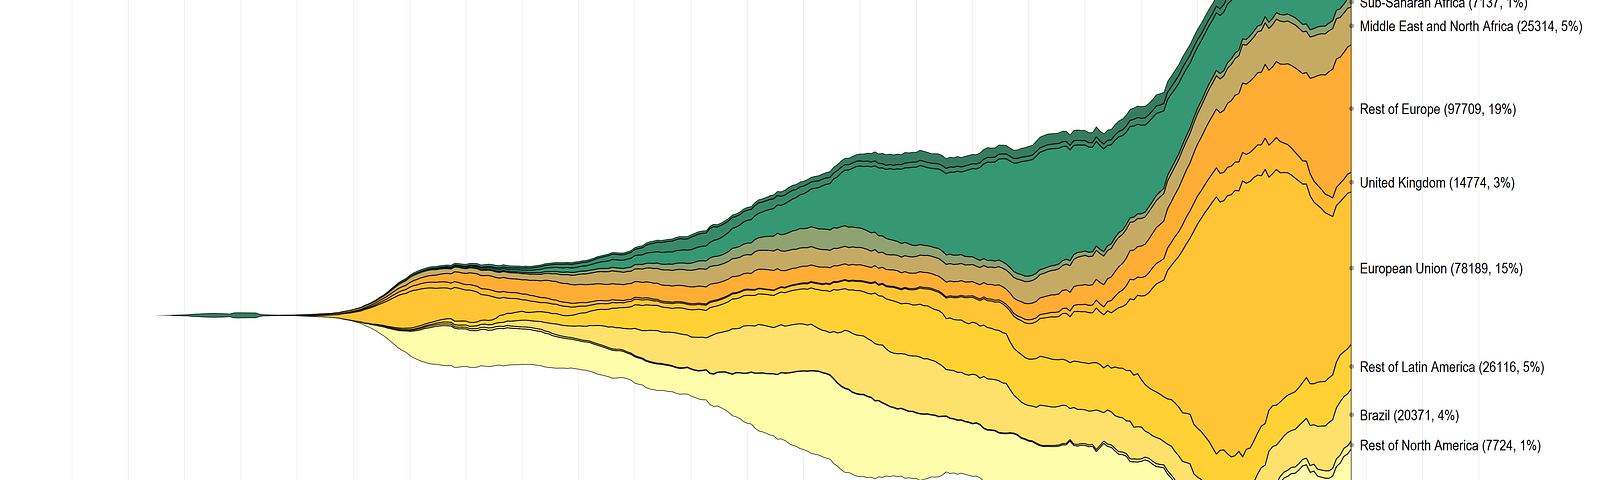
COVID-19 visualizations with Stata Part 10: Stream graphs
Read more…
3
Asjad Naqvi
in
The Stata Guide
Dec 1, 2020
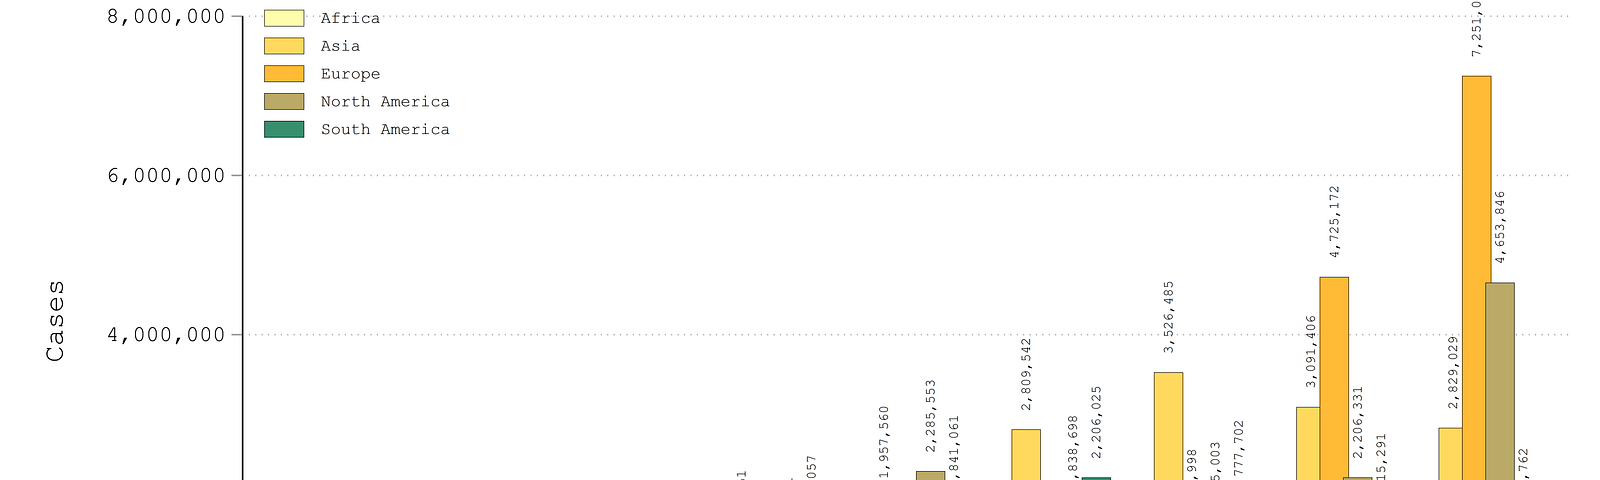
COVID-19 visualizations with Stata Part 9: Customized bar graphs
Read more…
37
Asjad Naqvi
in
The Stata Guide
Oct 30, 2020
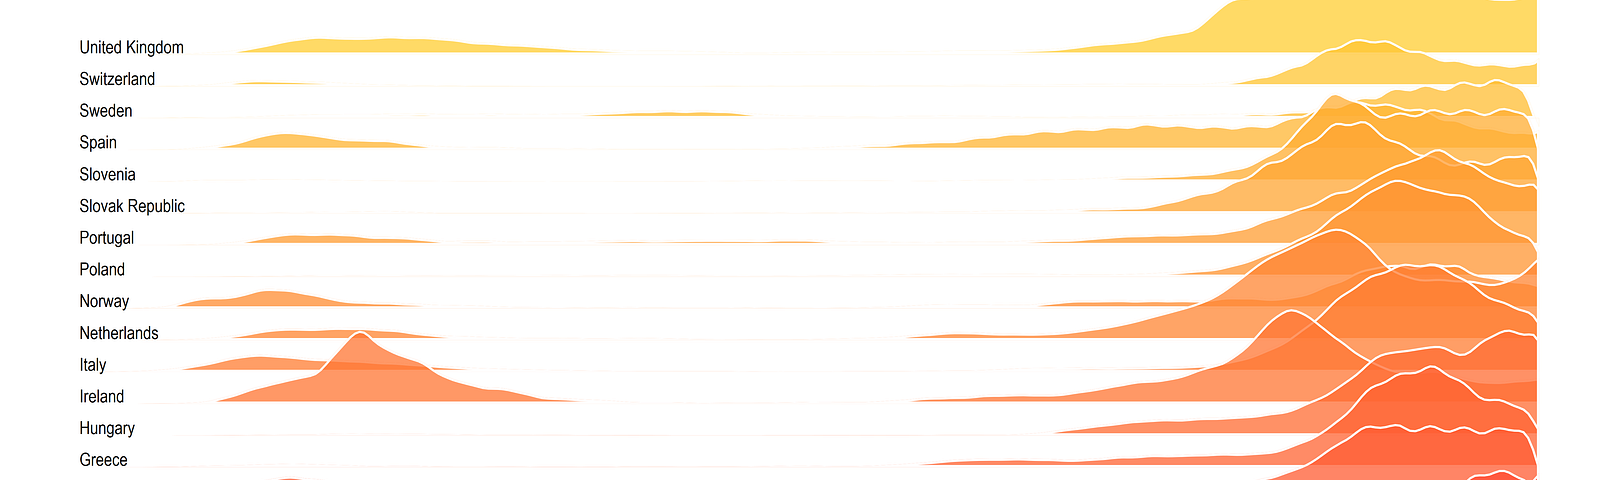
COVID-19 visualizations with Stata Part 8: Ridgeline plots (Joy plots)
Read more…
12
Asjad Naqvi
in
The Stata Guide
Oct 10, 2020
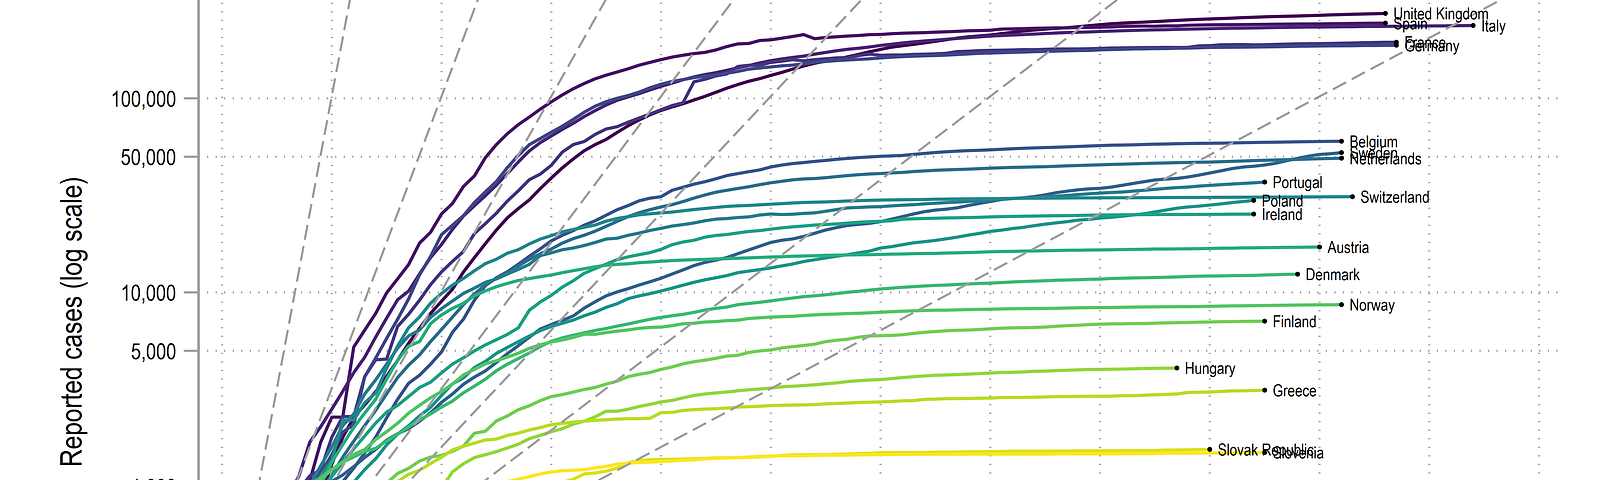
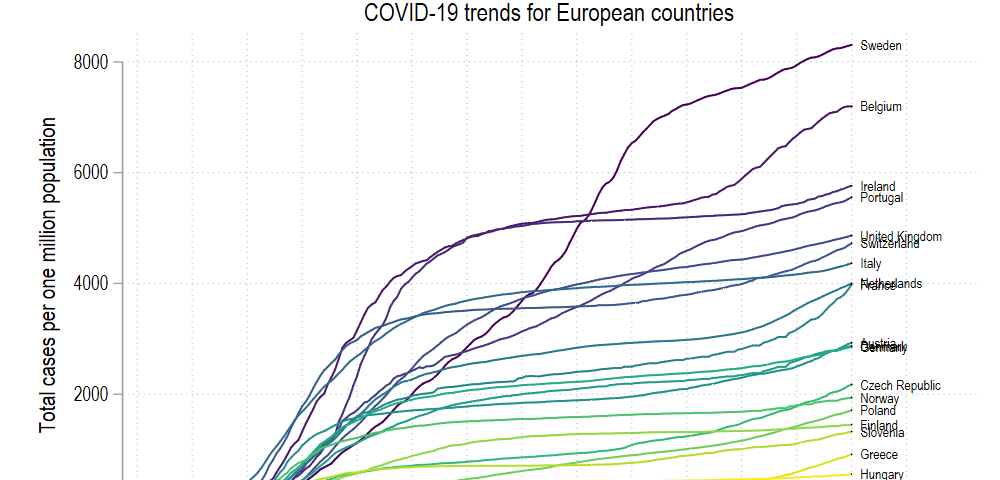
COVID-19 visualizations with Stata Part 7: Doubling time graphs
In this guide we will learn how to make the following doubling time graph in
Stata:
Read more…
1
Asjad Naqvi
in
The Stata Guide
Sep 22, 2020
COVID-19 visualizations with Stata Part 6: Animations
Read more…
5
Asjad Naqvi
in
The Stata Guide
Sep 16, 2020
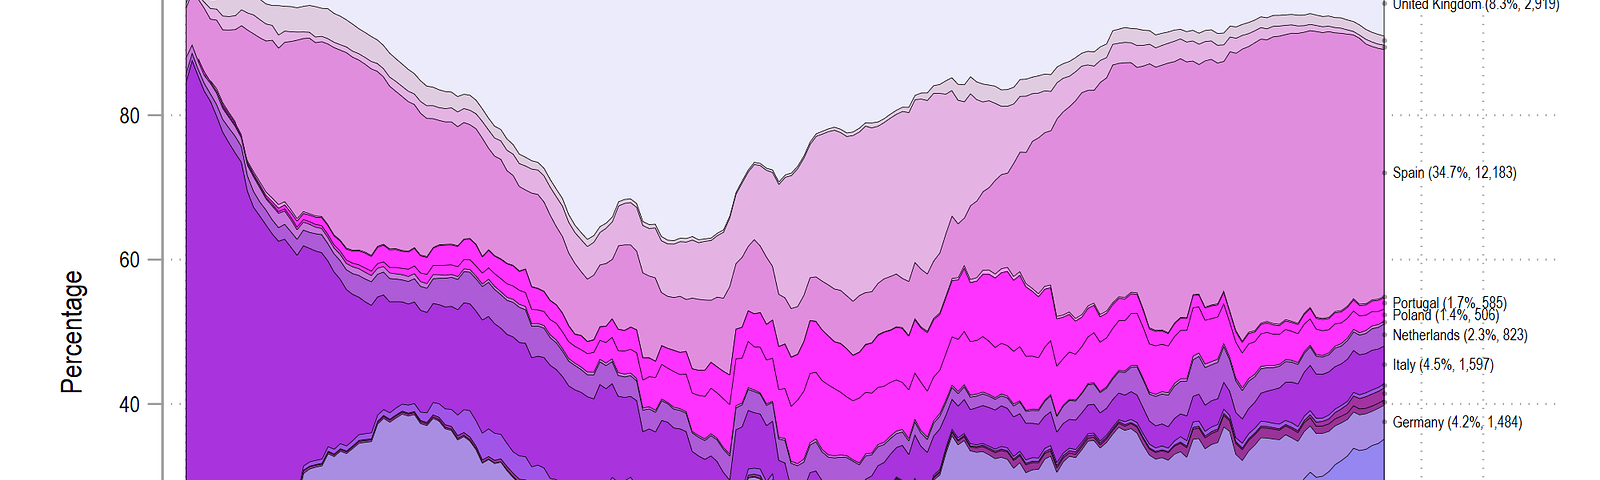
COVID-19 visualizations with Stata Part 5: Stacked area graphs
Read more…
4
Asjad Naqvi
in
The Stata Guide
Sep 7, 2020
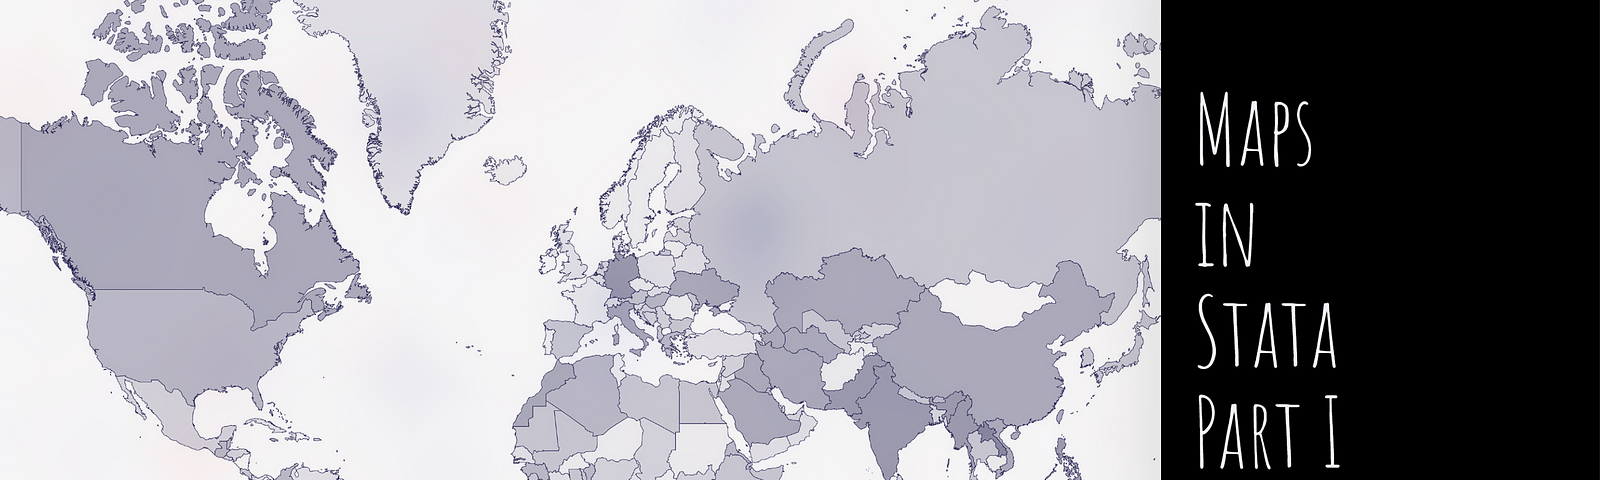
Maps in Stata — Part 1
Learn how to make maps in Stata. In this guide we will learn how to pull data…
Read more…
32
2 responses
Asjad Naqvi
in
The Stata Guide
Sep 2, 2020
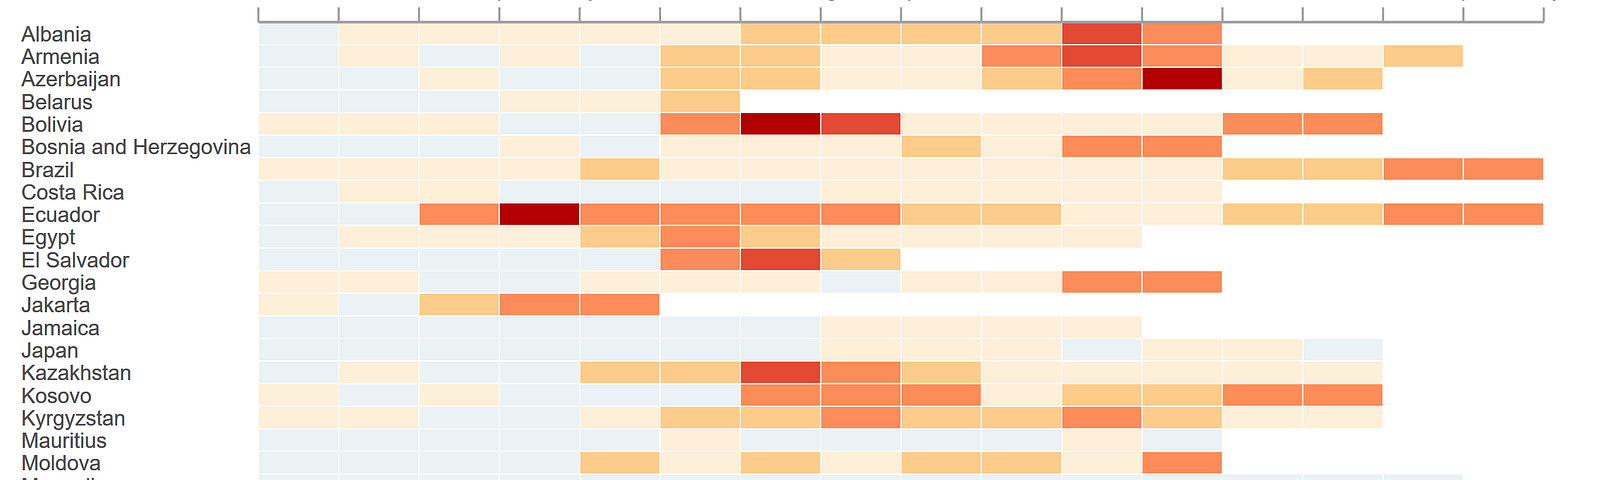
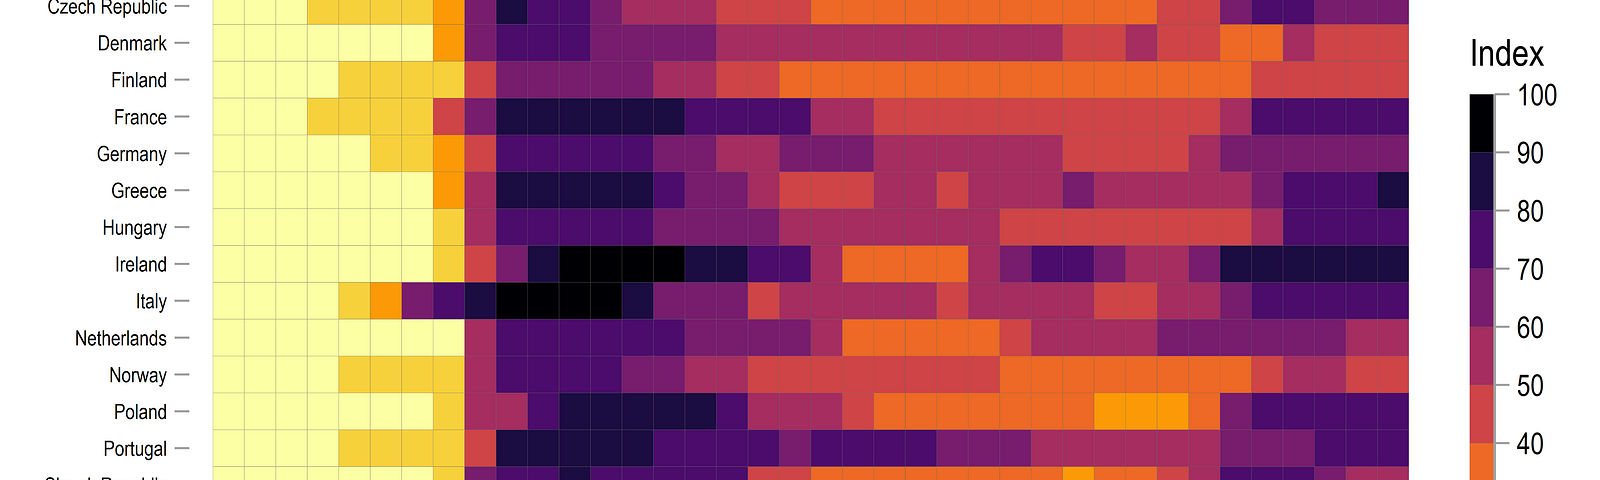
COVID-19 visualizations with Stata Part 3: Heatplots
Read more…
15
1 response
Asjad Naqvi
in
The Stata Guide
Aug 29, 2020
COVID-19 visualizations with Stata Part 2: Customizing colors schemes
Read more…
19
2 responses