Homepage
Open in app
Sign in
Get started
The Stata Guide
Welcome
Stata tips
LaTeX
Maps
Workflow
Programming
Blog
Tagged in
Data Visualization
The Stata Guide
Here we showcase a series of articles on the Stata software covering topics ranging from data science to statistical analysis.
More information
Followers
1.1K
Elsewhere
More, on Medium
Data Visualization
Asjad Naqvi
in
The Stata Guide
Jul 8
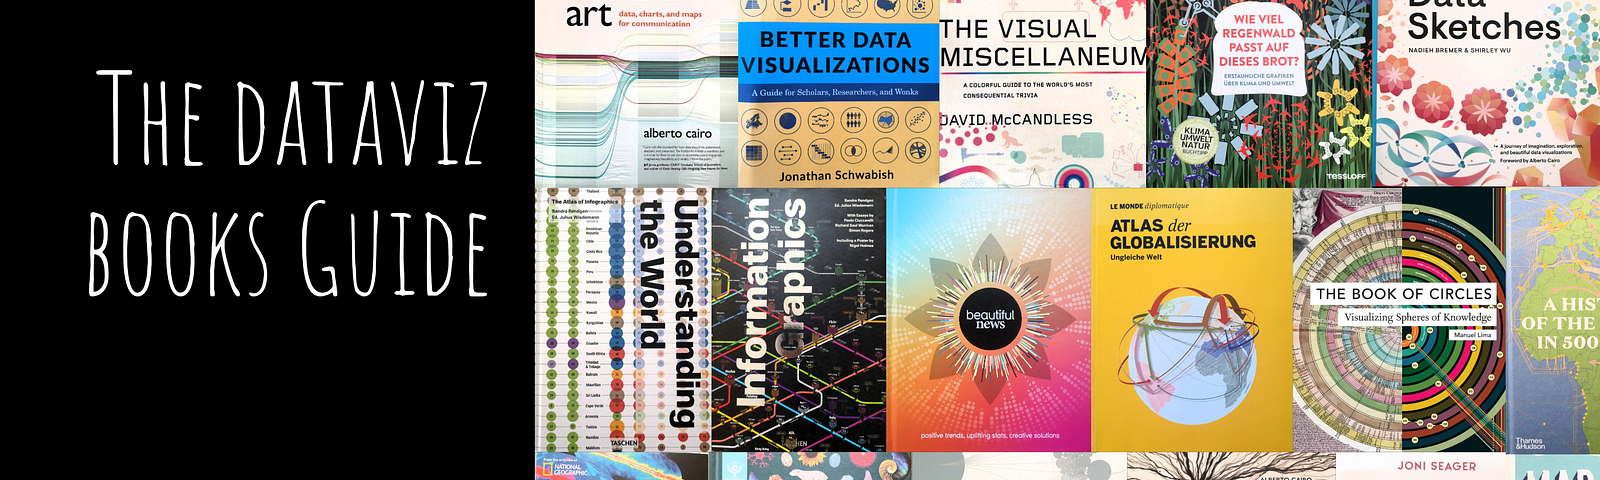
A Guide to DataViz Books
A preview of some 20+ data visualization and infographic books and their…
Read more…
63
Fahad Mirza
in
The Stata Guide
Jun 14, 2021
Stata Graph Replication: The Economist’s Covid-19 Excess Death visualization
Read more…
27
1 response
Asjad Naqvi
in
The Stata Guide
Mar 31, 2021
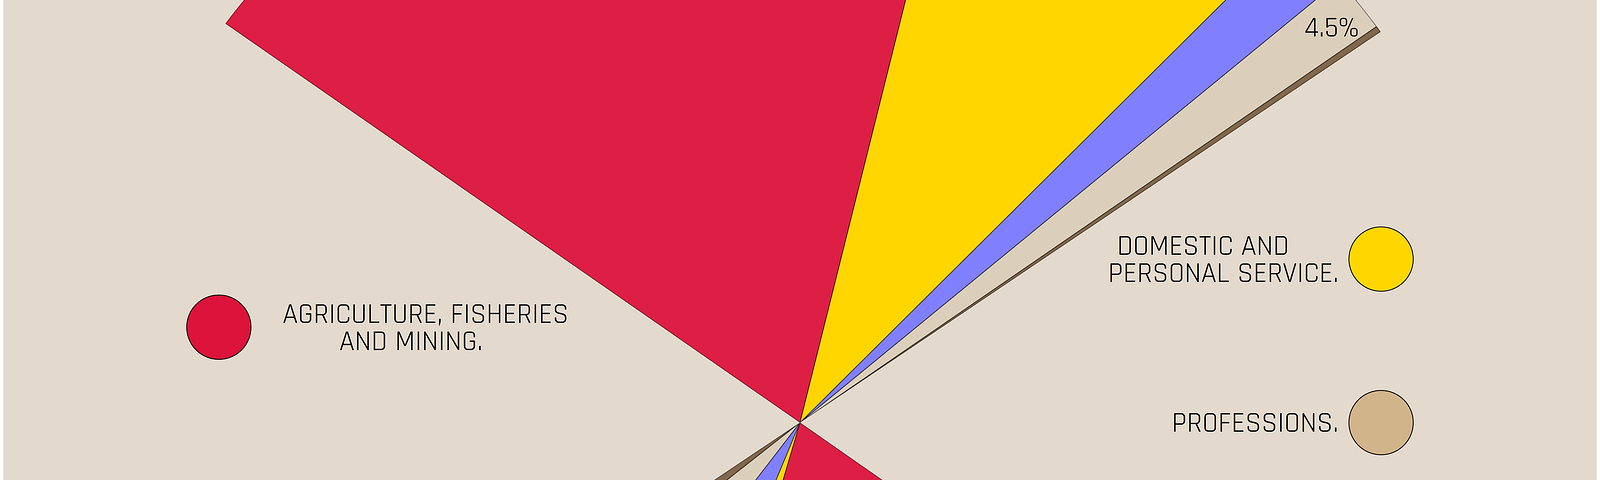
Stata graph replication: The Du Bois Challenge
This guide will present Stata code and discussion…
Read more…
9
Asjad Naqvi
in
The Stata Guide
Nov 23, 2020
Stata graphs: Define your own color schemes
In this guide learn how to define your own color templates…
Read more…
23
2 responses
Asjad Naqvi
in
The Stata Guide
Oct 10, 2020
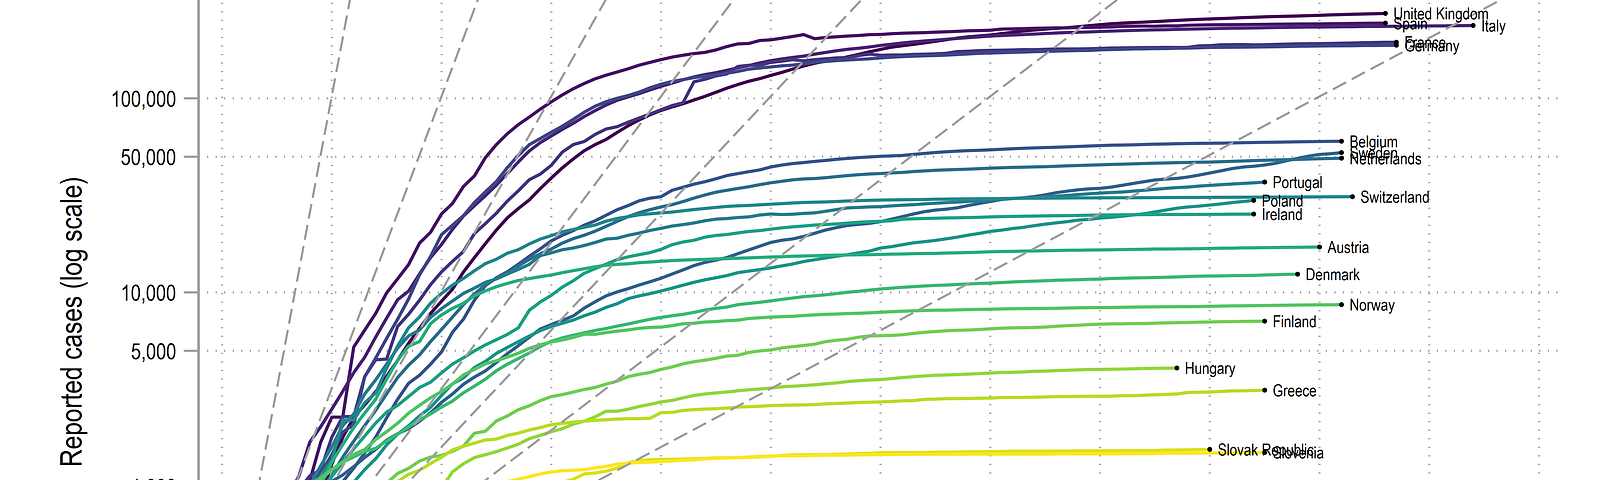
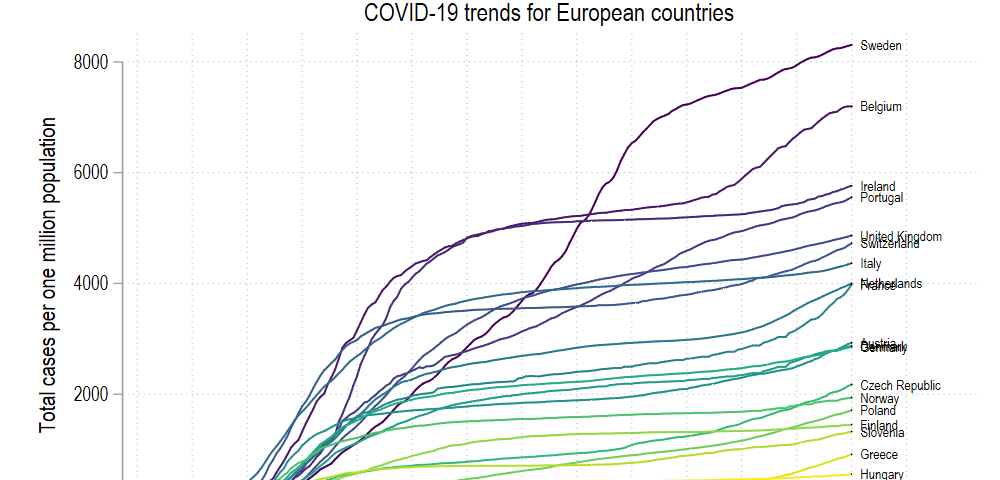
COVID-19 visualizations with Stata Part 7: Doubling time graphs
In this guide we will learn how to make the following doubling time graph in
Stata:
Read more…
1
Asjad Naqvi
in
The Stata Guide
Sep 2, 2020
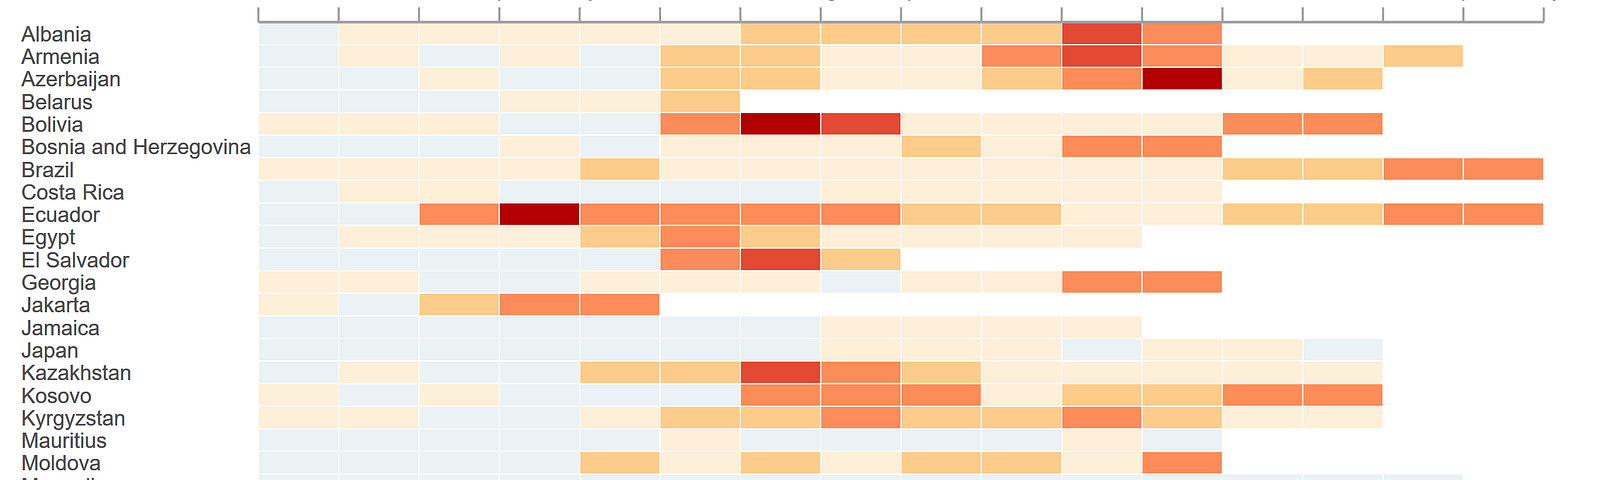
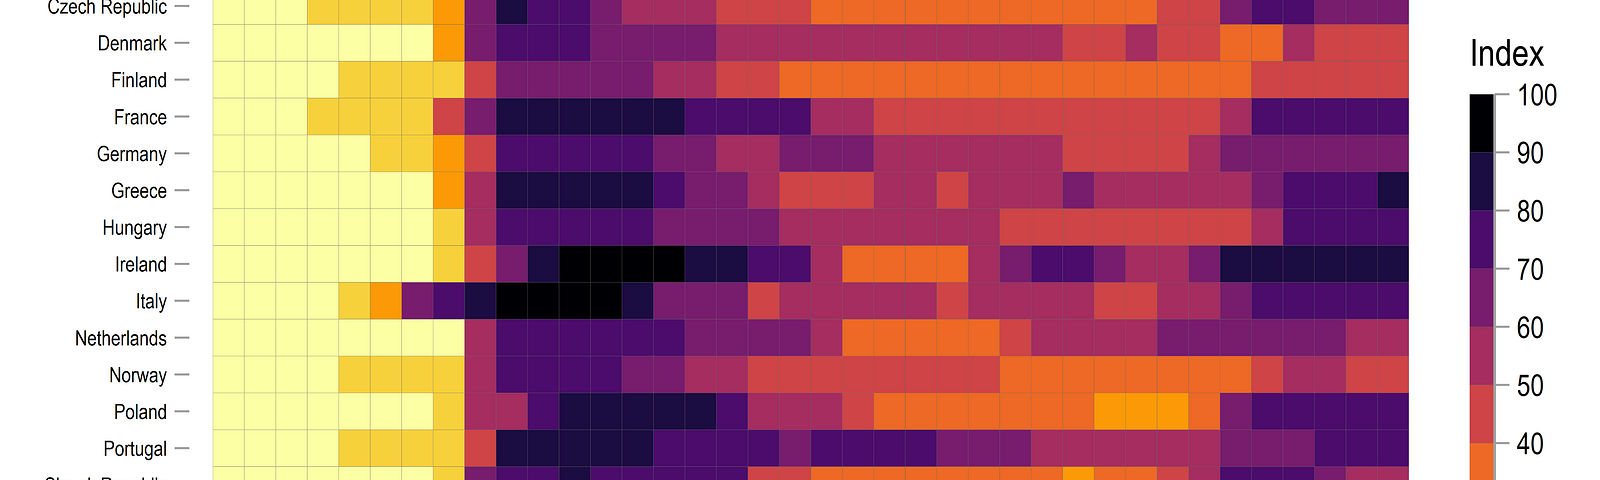
COVID-19 visualizations with Stata Part 3: Heatplots
Read more…
15
1 response
Asjad Naqvi
in
The Stata Guide
Aug 29, 2020
COVID-19 visualizations with Stata Part 2: Customizing colors schemes
Read more…
19
2 responses