Homepage
Open in app
Sign in
Get started
The Stata Guide
Welcome
Stata tips
LaTeX
Maps
Workflow
Programming
Blog
Tagged in
Graph
The Stata Guide
Here we showcase a series of articles on the Stata software covering topics ranging from data science to statistical analysis.
More information
Followers
1K
Elsewhere
More, on Medium
Graph
Asjad Naqvi
in
The Stata Guide
Sep 16, 2022
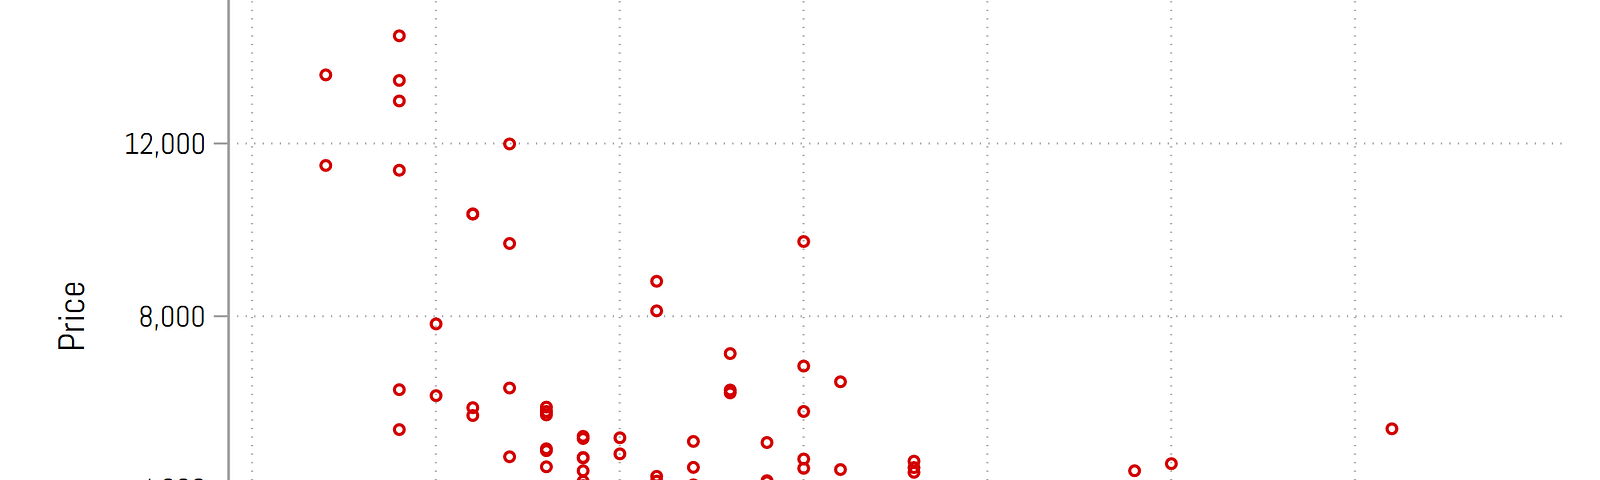
Stata graph tips for academic articles
Learn tips and tricks for optimizing Stata graphs for journal…
Read more…
144
2 responses
Asjad Naqvi
in
The Stata Guide
Jun 15, 2022
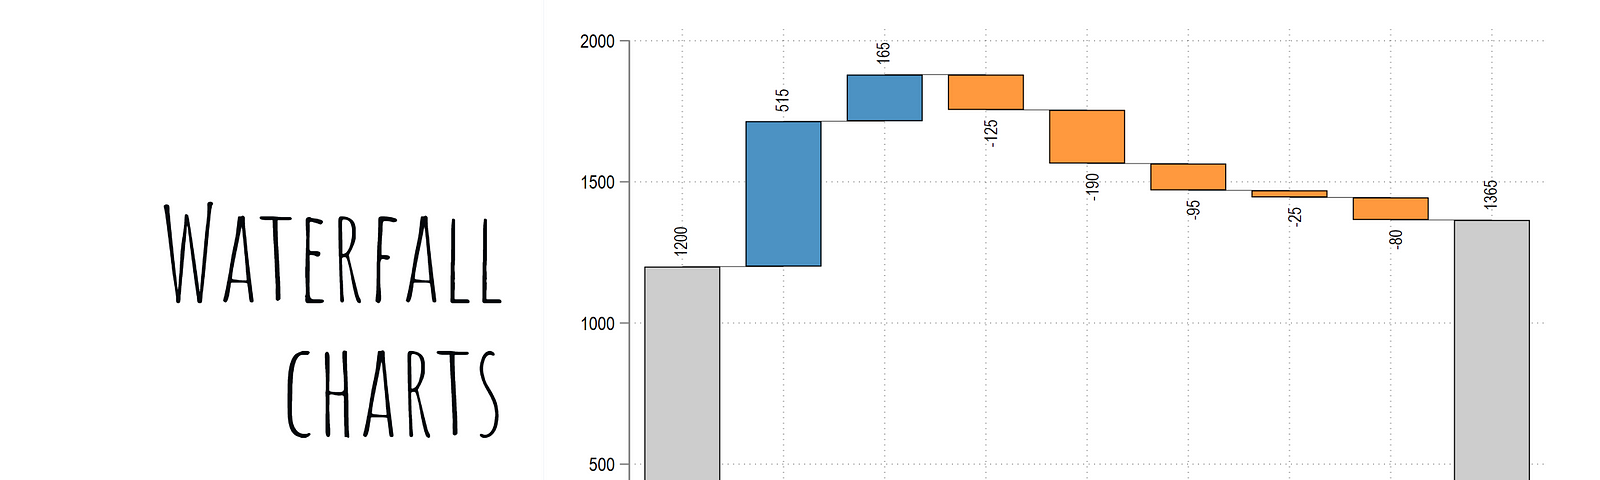
Stata graphs: Waterfall charts
In this guide, learn how to create waterfall charts to visualize stocks…
Read more…
7
Asjad Naqvi
in
The Stata Guide
Apr 29, 2022
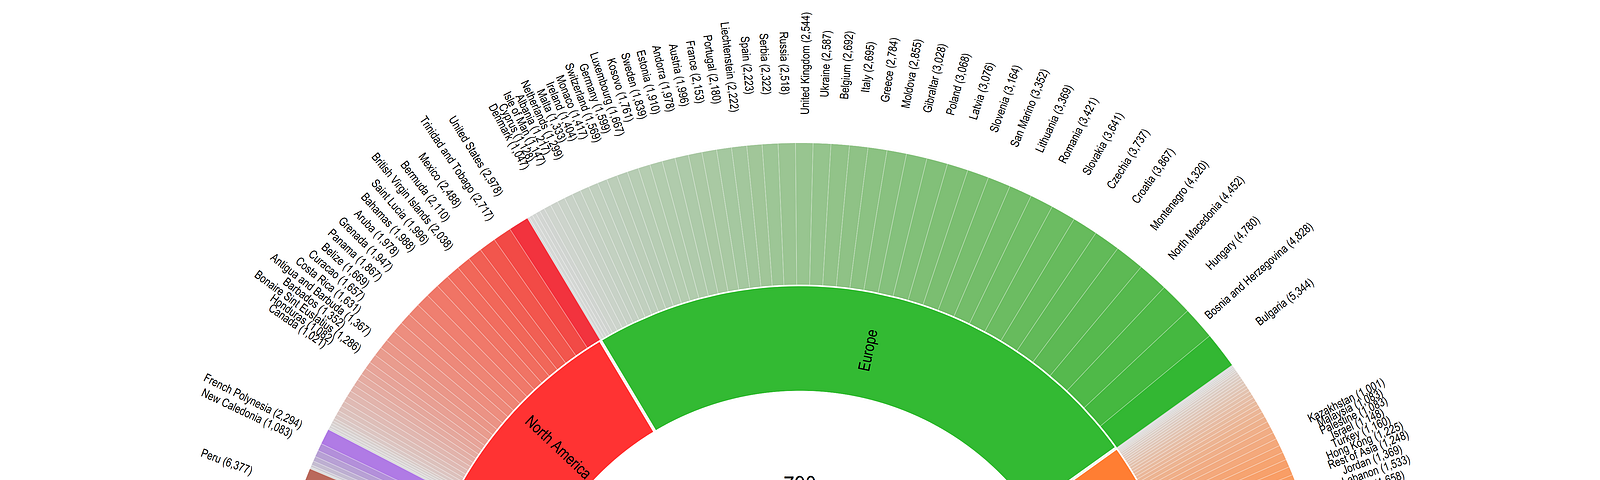
Stata graphs: Half Sunburst plot
In this guide, learn how to graph hierarchical data using a half…
Read more…
13
2 responses
Asjad Naqvi
in
The Stata Guide
Apr 20, 2022
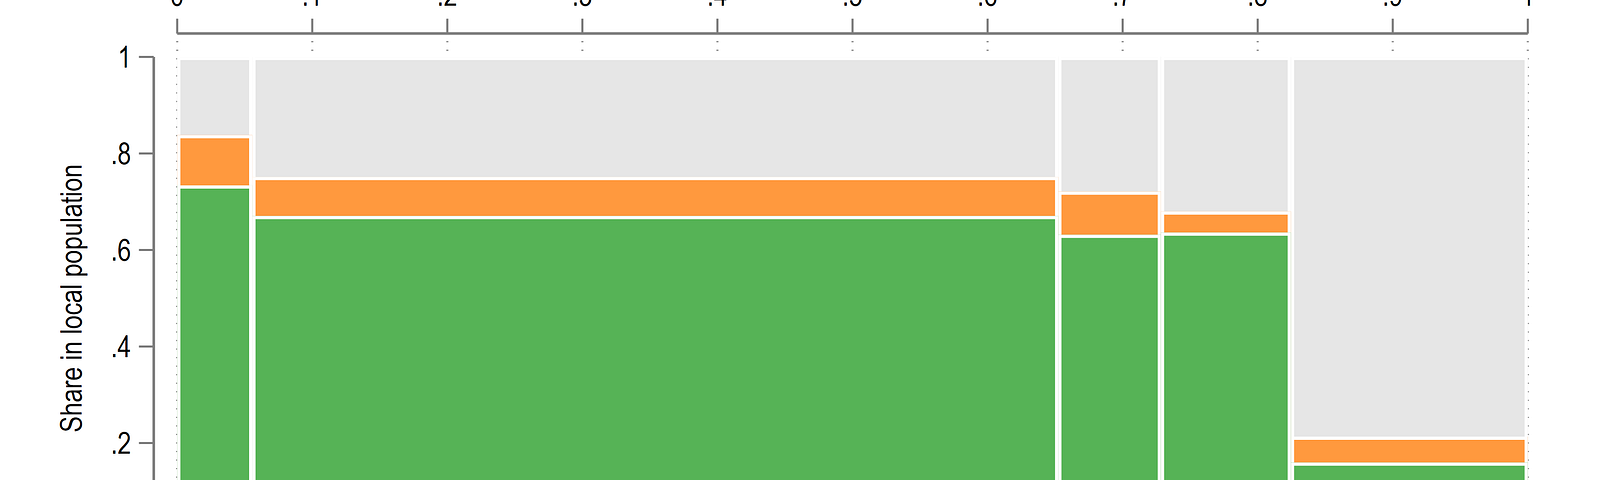
Stata graphs: Mosaic (Marimekko) plots
In this guide, we will learn to make custom mosaic or Marimekko…
Read more…
7
Asjad Naqvi
in
The Stata Guide
Oct 26, 2021
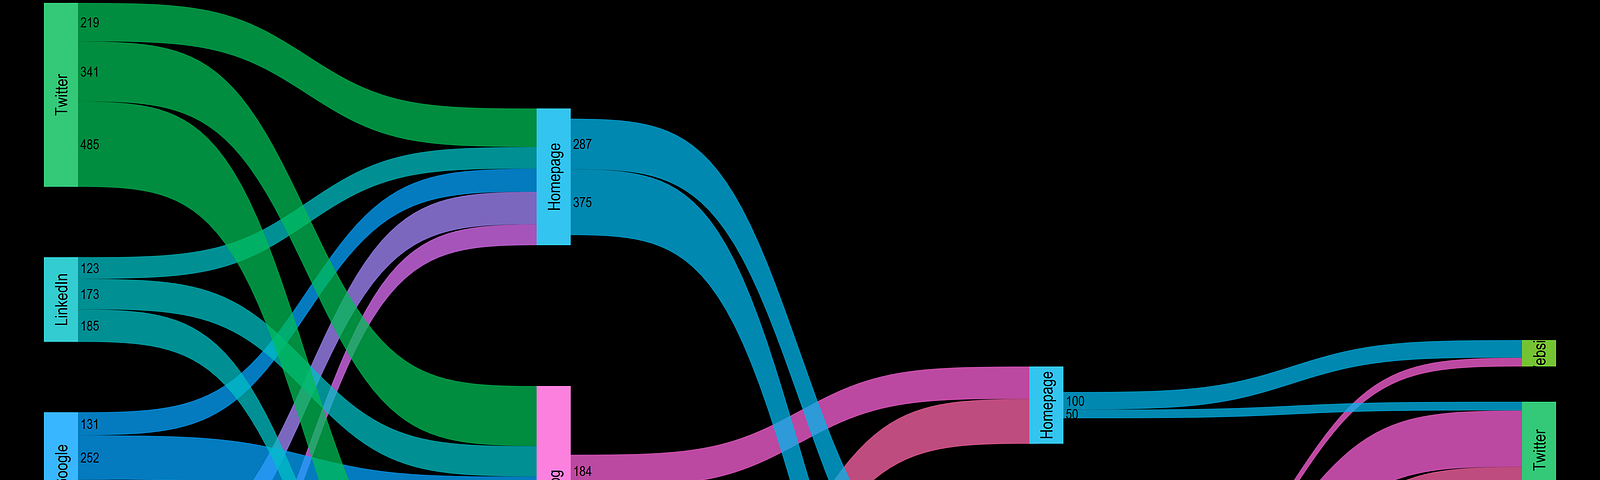
Stata graphs: Sankey diagram
In this guide we will learn how to program the a Sankey diagram in Stata.
Read more…
28
2 responses
Asjad Naqvi
in
The Stata Guide
Oct 12, 2021
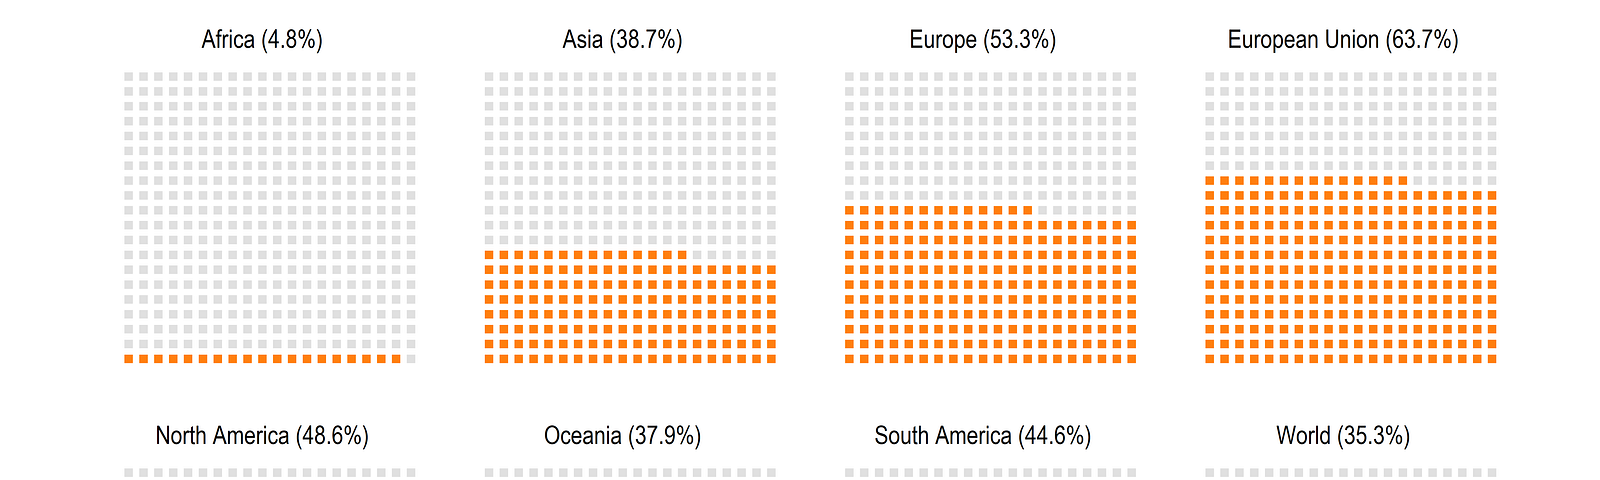
Stata graphs: Waffle charts
In this guide, learn to program Waffle charts. Waffle charts are similar…
Read more…
15
Asjad Naqvi
in
The Stata Guide
Apr 13, 2021
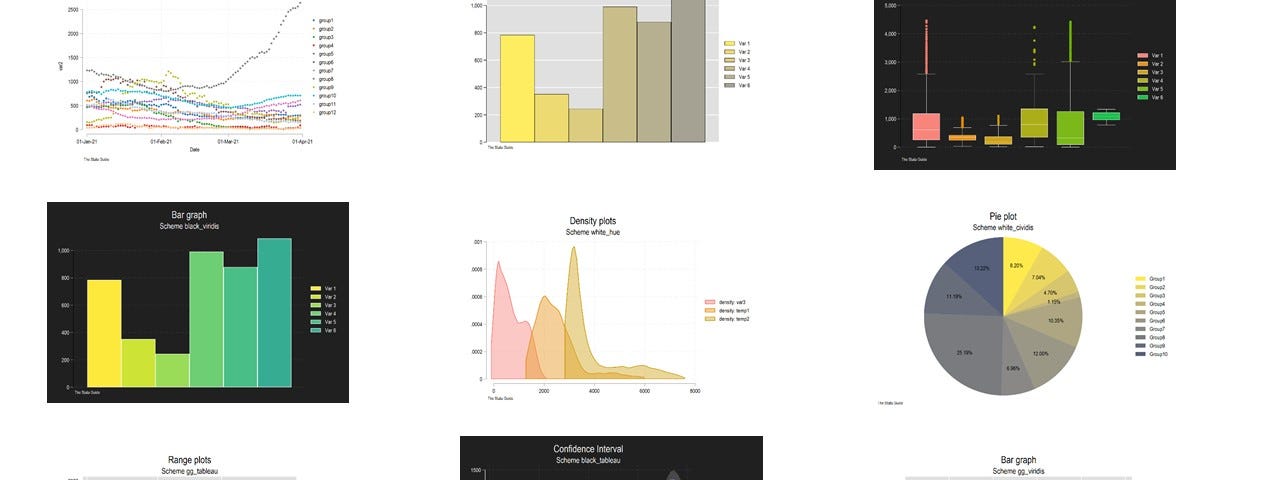
Stata schemes
Learn how to create your own Stata graph scheme. Several new schemes are also released…
Read more…
117
1 response
Asjad Naqvi
in
The Stata Guide
Nov 3, 2020
Stata graphs: Get those fonts right
Learn how to install and customize fonts in Stata figures.
Read more…
63
5 responses
Asjad Naqvi
in
The Stata Guide
Sep 16, 2020
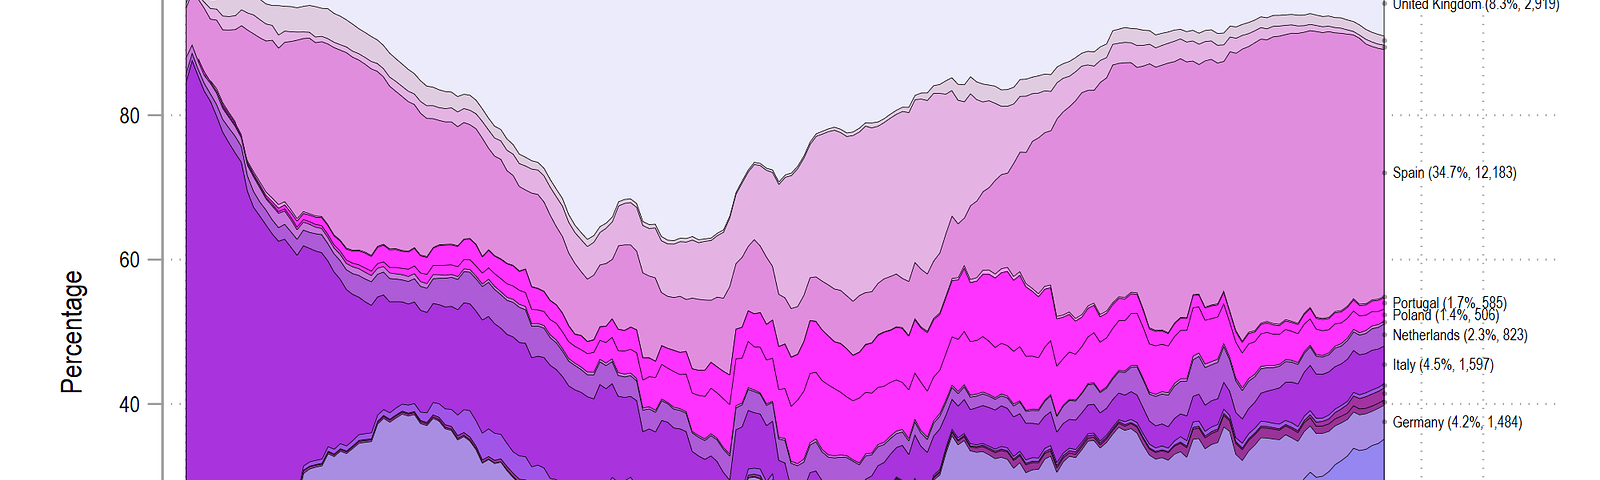
COVID-19 visualizations with Stata Part 5: Stacked area graphs
Read more…
4