Homepage
Open in app
Sign in
Get started
The Stata Guide
Welcome
Stata tips
LaTeX
Maps
Workflow
Programming
Blog
Tagged in
Visualization
The Stata Guide
Here we showcase a series of articles on the Stata software covering topics ranging from data science to statistical analysis.
More information
Followers
1.1K
Elsewhere
More, on Medium
Visualization
Asjad Naqvi
in
The Stata Guide
Mar 10, 2021
Stata graphs: Programming pie charts from scratch
Read more…
2
1 response
Asjad Naqvi
in
The Stata Guide
Feb 8, 2021
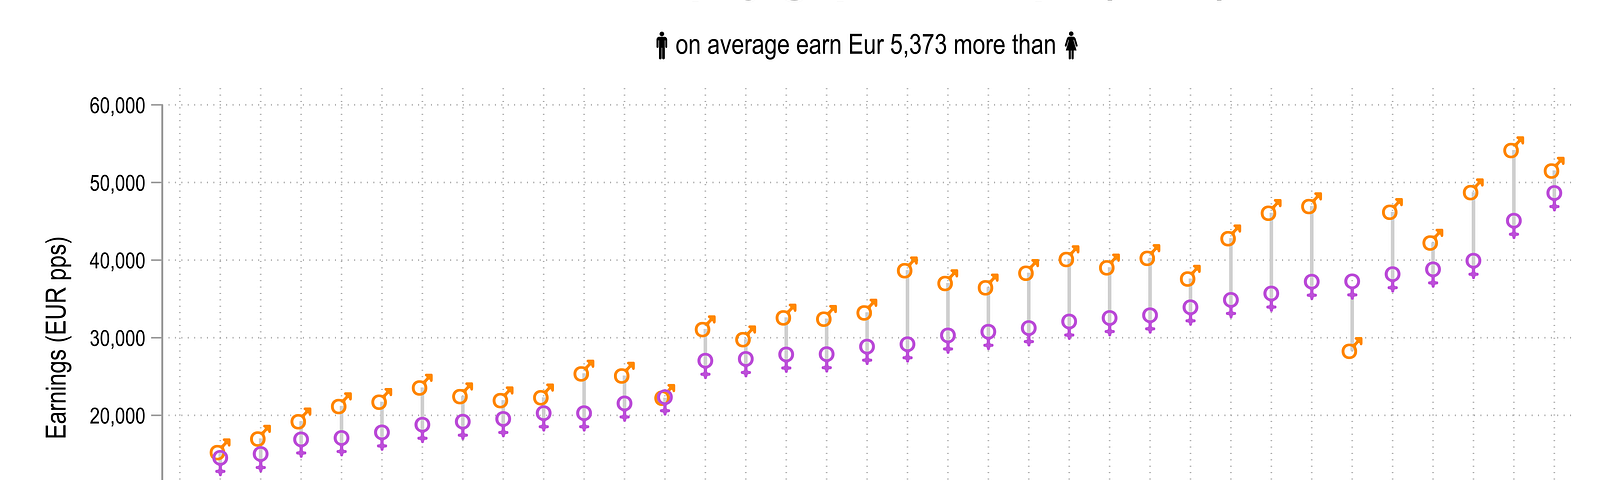
Stata graphs: Symbols
In this Stata guide, learn how to use symbols in graphs.
Read more…
64
Asjad Naqvi
in
The Stata Guide
Jan 26, 2021
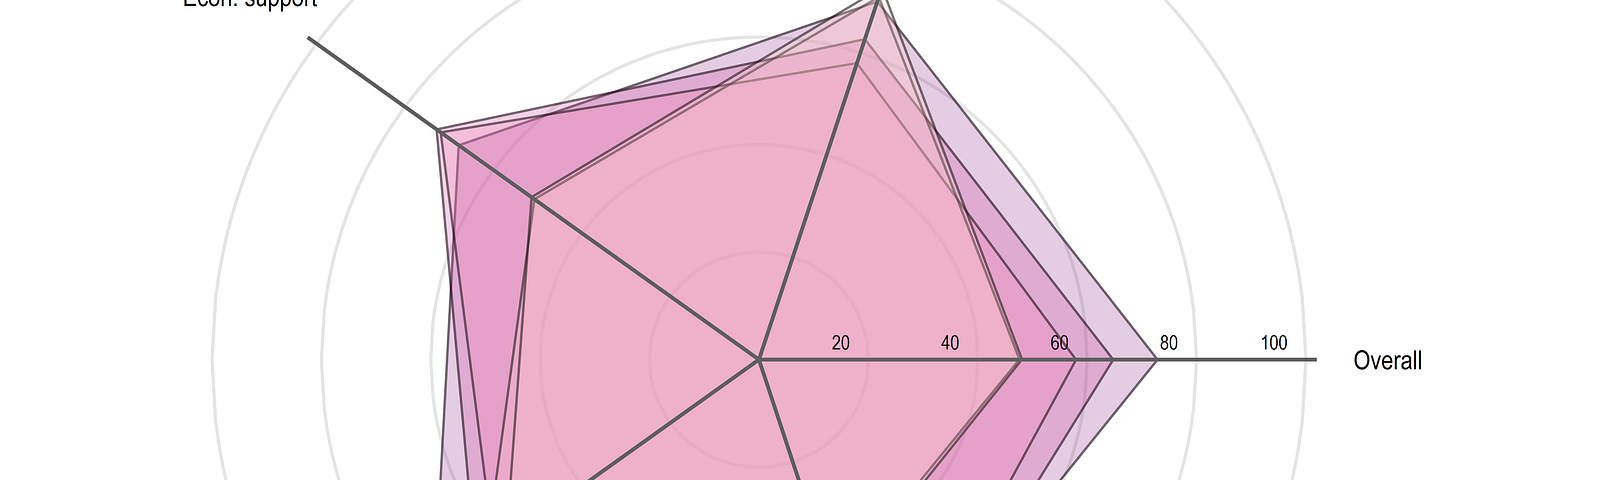
Stata graphs: Spider plots
Learn how to make Spider plots in Stata and apply them to the Oxford…
Read more…
21
1 response
Asjad Naqvi
in
The Stata Guide
Dec 9, 2020
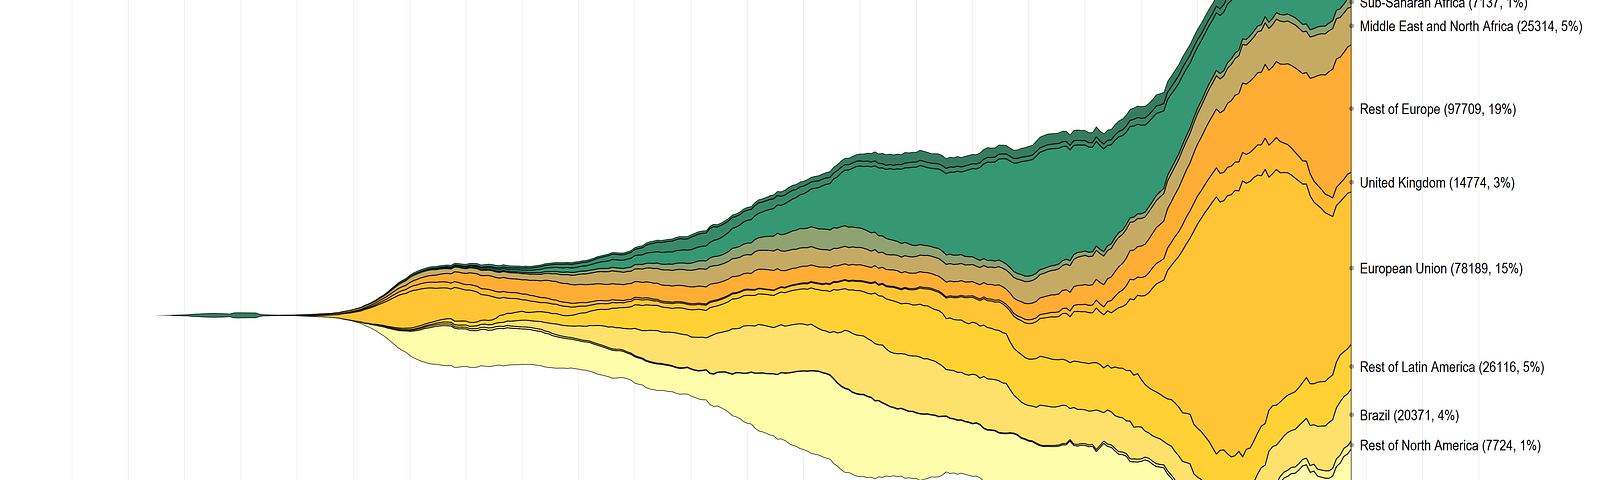
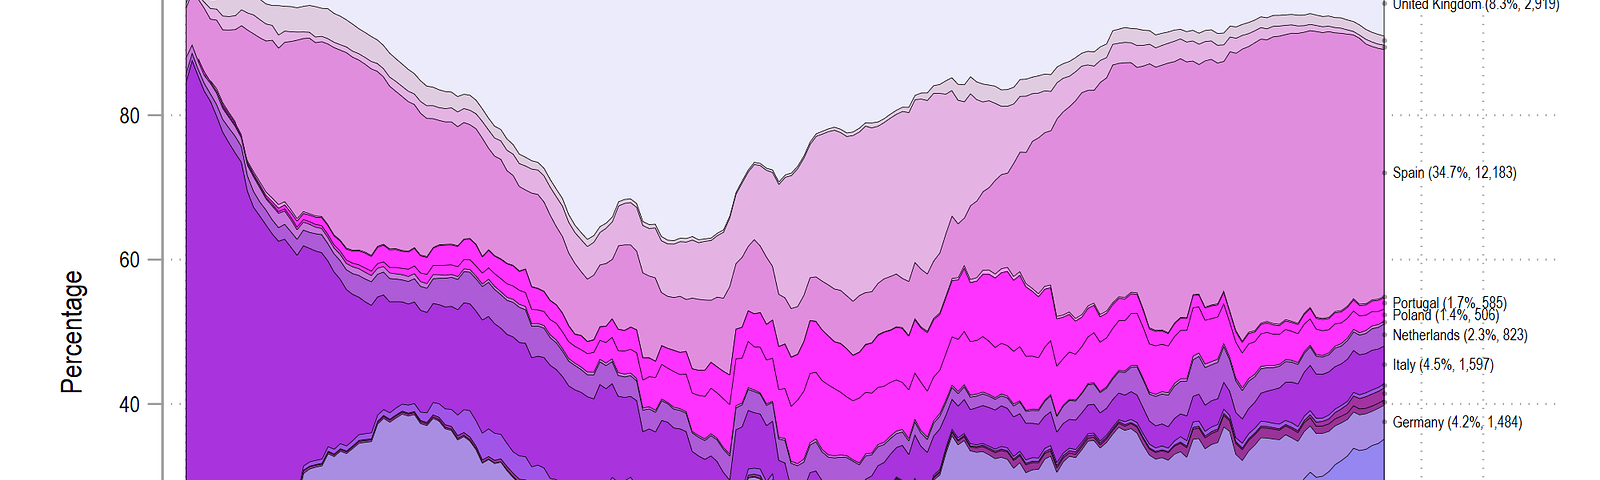
COVID-19 visualizations with Stata Part 10: Stream graphs
Read more…
3
Asjad Naqvi
in
The Stata Guide
Nov 3, 2020
Stata graphs: Get those fonts right
Learn how to install and customize fonts in Stata figures.
Read more…
63
5 responses
Asjad Naqvi
in
The Stata Guide
Sep 16, 2020
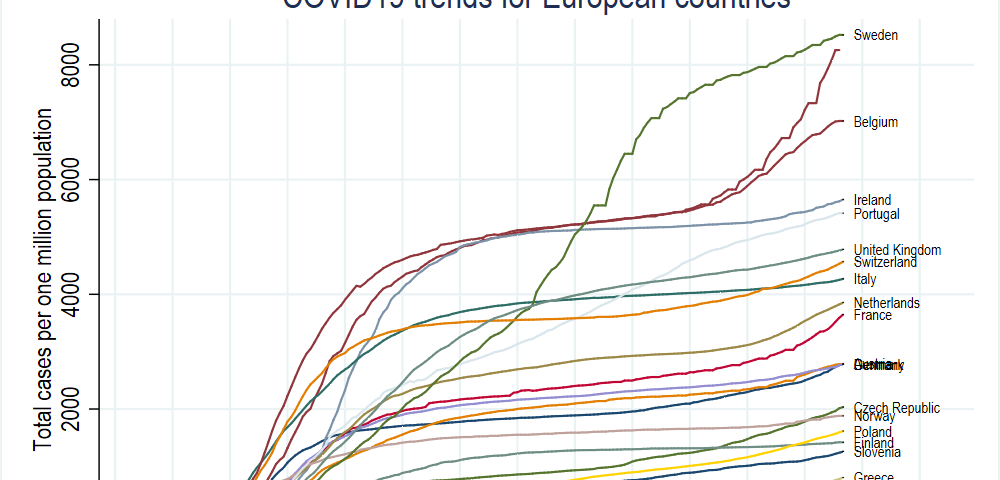
COVID-19 visualizations with Stata Part 5: Stacked area graphs
Read more…
4
Asjad Naqvi
in
The Stata Guide
Aug 25, 2020
COVID-19 visualizations with Stata Part 1: An introduction to data setup and customized graphs
Read more…
20
1 response