Homepage
Open in app
VisUMD
Sign in
Get started
Tagged in
Data Visualization
VisUMD
Visualization at University of Maryland
More information
Followers
182
More, on Medium
Data Visualization
Samita Prakash Belliganood
in
VisUMD
Oct 31, 2023
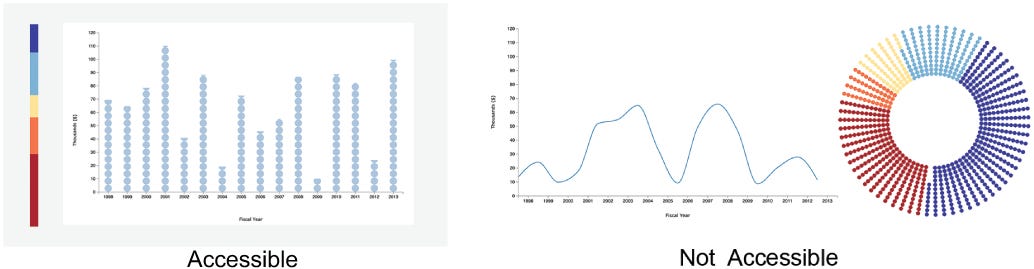
Visualizing Change: The Journey Towards Inclusive Data Accessibility
Read more…
13
Jay Patel
in
VisUMD
Oct 31, 2023
Bit by bit: how to show frequencies with animated unit visualizations
Read more…
Prasshanna s
in
VisUMD
Nov 1, 2023
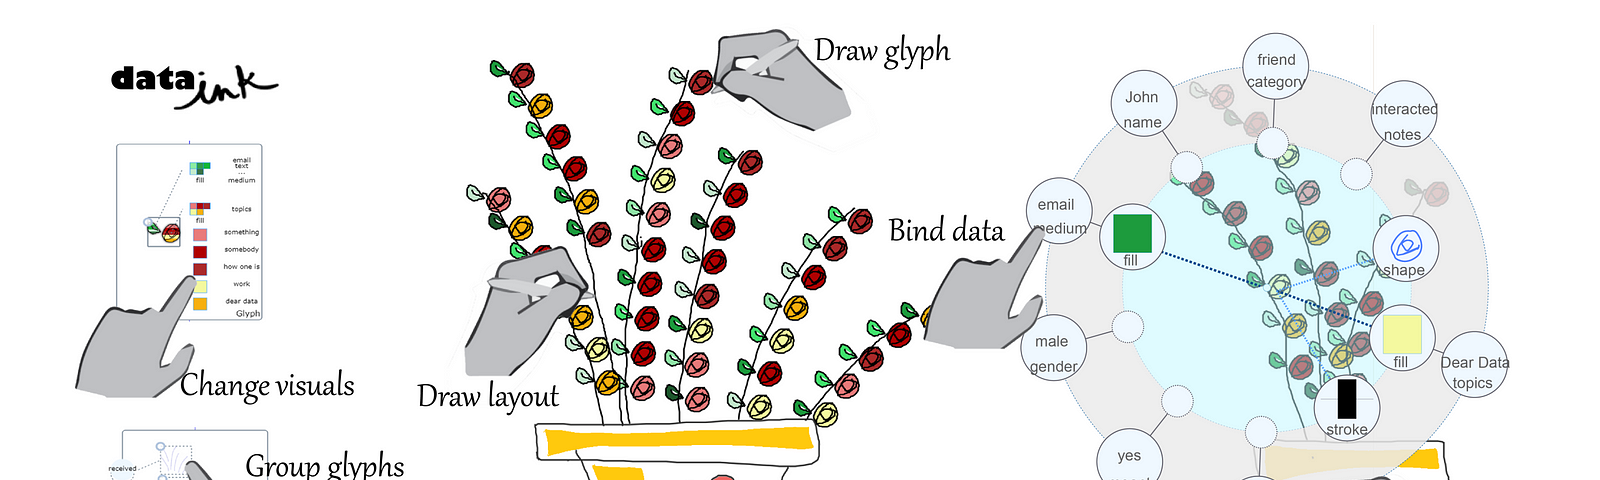
Unveiling DataInk: A Paradigm Shift in Data Visualization
Read more…
102
Sravya Lenka
in
VisUMD
Nov 1, 2023
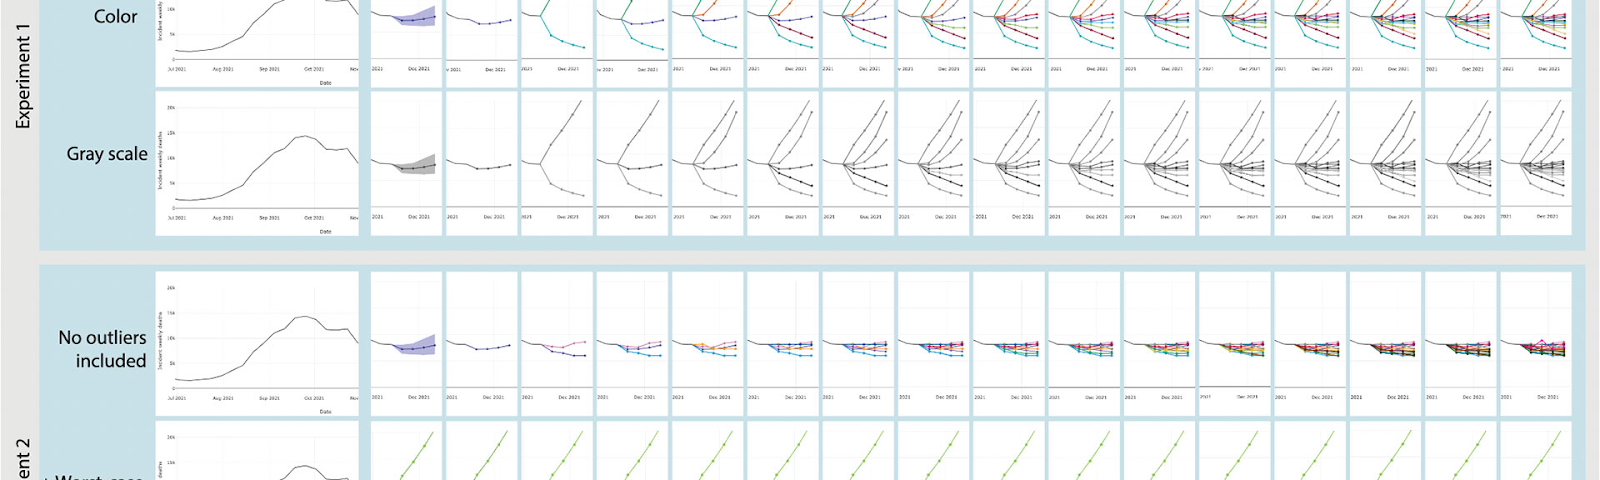
COVID-19 Multi Forecast Visualizations: Trust or Distrust?
Examining the factors affecting trust and…
Read more…
Nupur Wagle
in
VisUMD
Oct 27, 2023
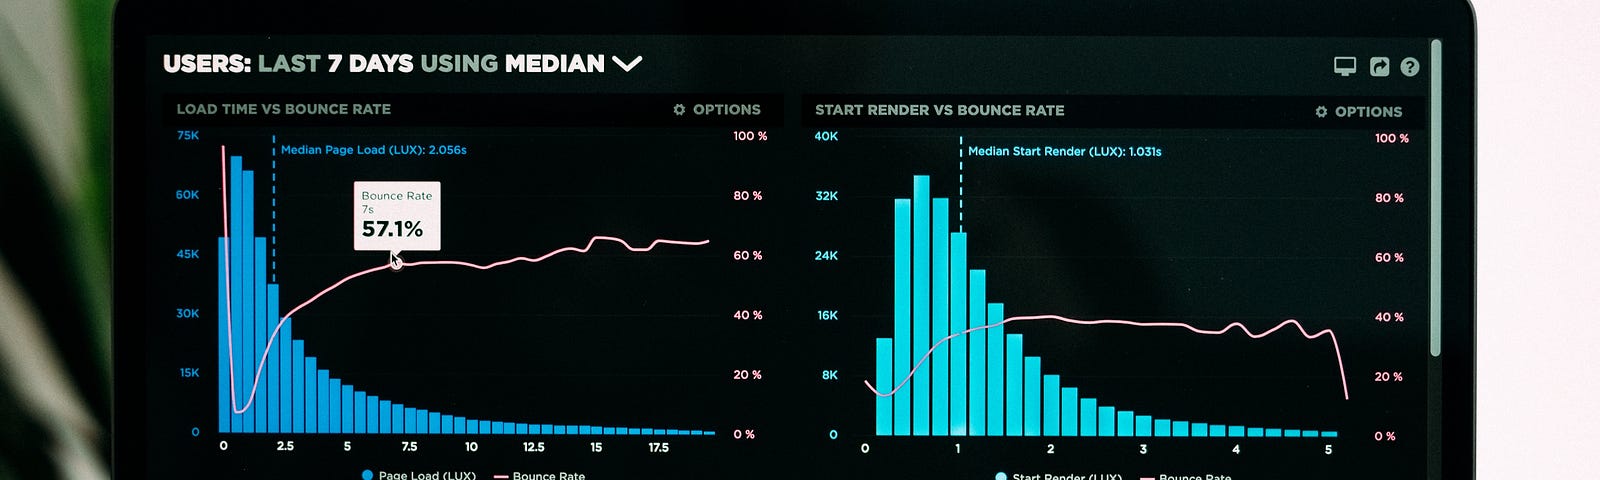
IS A PICTURE ALWAYS WORTH A THOUSAND WORDS?
Uncover the secrets of what makes some visualizations more effective than others
Read more…
4
Abhiram Reddy Kadimetla
in
VisUMD
Dec 16, 2022
Your Pol(l)s May Be Lying to You
How text visualization can help in understanding politics.
Read more…
Sourabh Mane
in
VisUMD
Dec 16, 2022
Revisualizing Multiplayer Madness
Spatio-temporal visualization for analyzing video game replays.
Read more…
25
Apoorva Shridhar
in
VisUMD
Dec 13, 2022
What To Read?
Using data visualization to personalize book recommendations.
Read more…
Pooja Pandey
in
VisUMD
Dec 15, 2022
We’re Not Superstitious, But We Are A Little-Stitious
Visualizing the most and least popular days to…
Read more…
13
Sejal Singh
in
VisUMD
Dec 14, 2022
Defeating Fate
A data-driven approach to minimize risk posed by inherited diseases
Read more…