Homepage
Open in app
VisUMD
Sign in
Get started
Tagged in
Data Visualization Tools
VisUMD
Visualization at University of Maryland
More information
Followers
183
More, on Medium
Data Visualization Tools
Ramsay Patrick Farah
in
VisUMD
Dec 15, 2022
Crime, DMV.
Crime in the D.C., Maryland, and Virginia region.
Read more…
Kurt Dahl
in
VisUMD
Dec 12, 2022
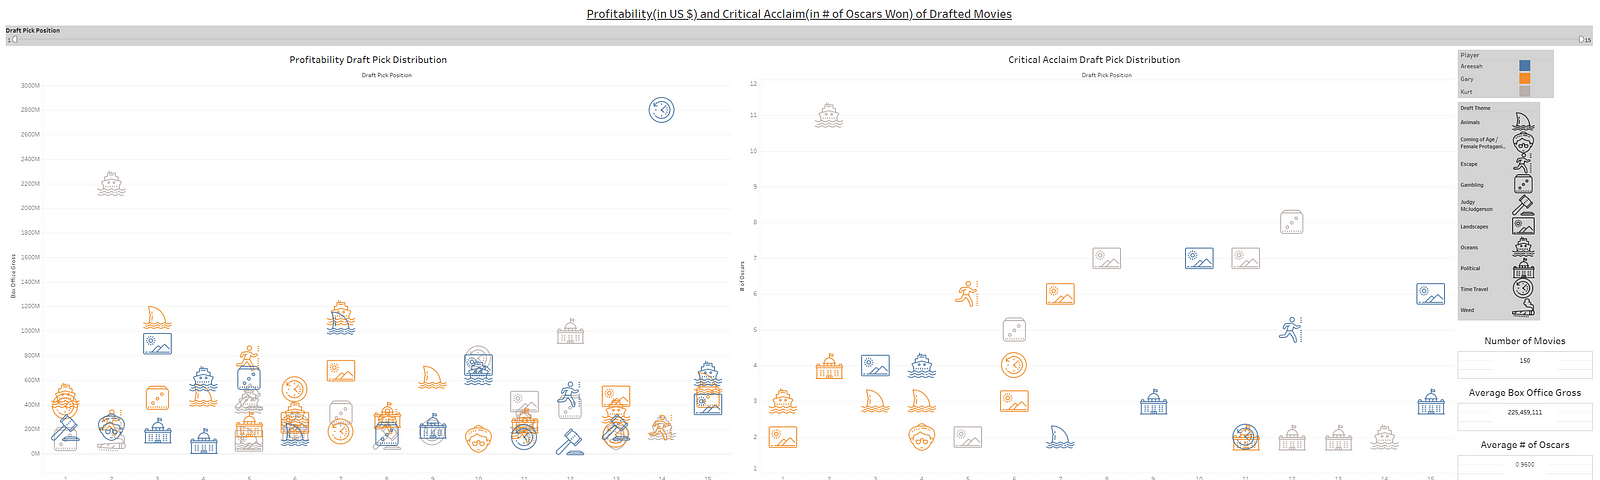
The Big(ger) Picture
A dashboard based on a podcast based on a love of movies.
Read more…
Alechacon
in
VisUMD
Oct 24, 2022
Connecting Chrome
VisConnect is a web-based distributed collaborative visualization system.
Read more…
Sejal Singh
in
VisUMD
Nov 3, 2022
Forget Me Not
Leveraging analysis history for visualization recommendation.
Read more…
5
Yasvi Patel
in
VisUMD
Oct 26, 2021
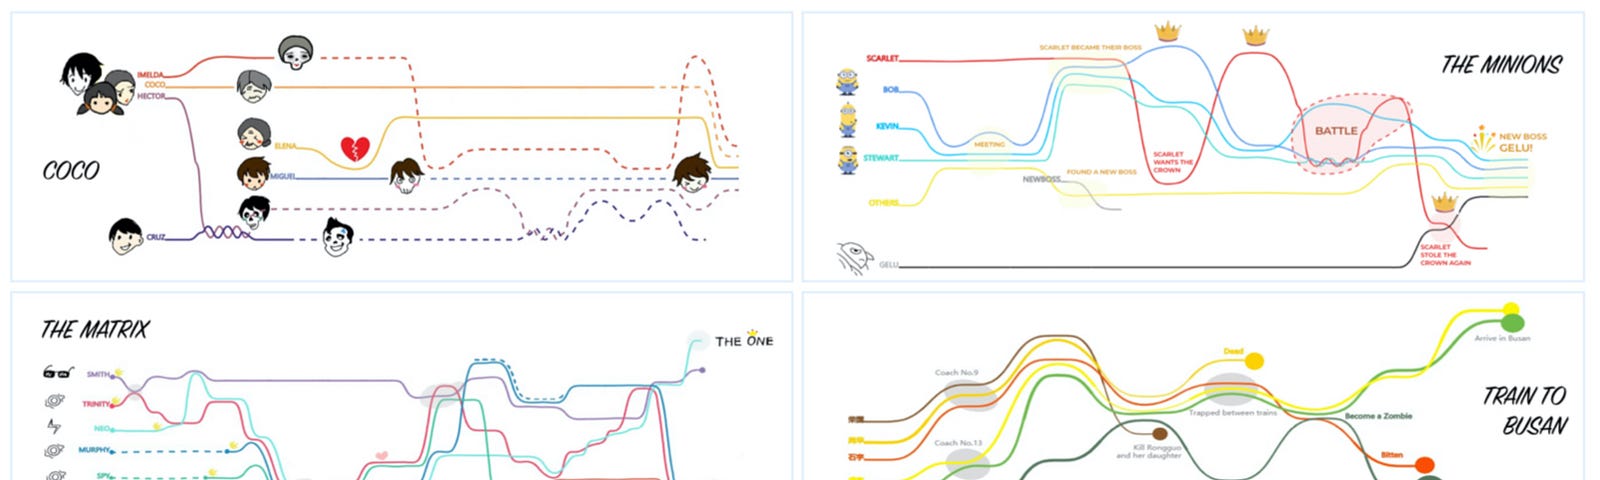
Taking Turns to Plot
Collaborating with the computer to create storylines.
Read more…
3
Alea Oakman
in
VisUMD
Oct 26, 2021
When You Need More Than a Thousand Words
Natural language to support data visualization.
Read more…
Sparsh Paliwal
in
VisUMD
Oct 25, 2021
Animated Infographics — Just a Click Away!
Automatically turning a static infographic into a dynamic…
Read more…
23