Homepage
Open in app
VisUMD
Sign in
Get started
Tagged in
Visualization
VisUMD
Visualization at University of Maryland
More information
Followers
183
More, on Medium
Visualization
Sravya Lenka
in
VisUMD
Nov 1, 2023
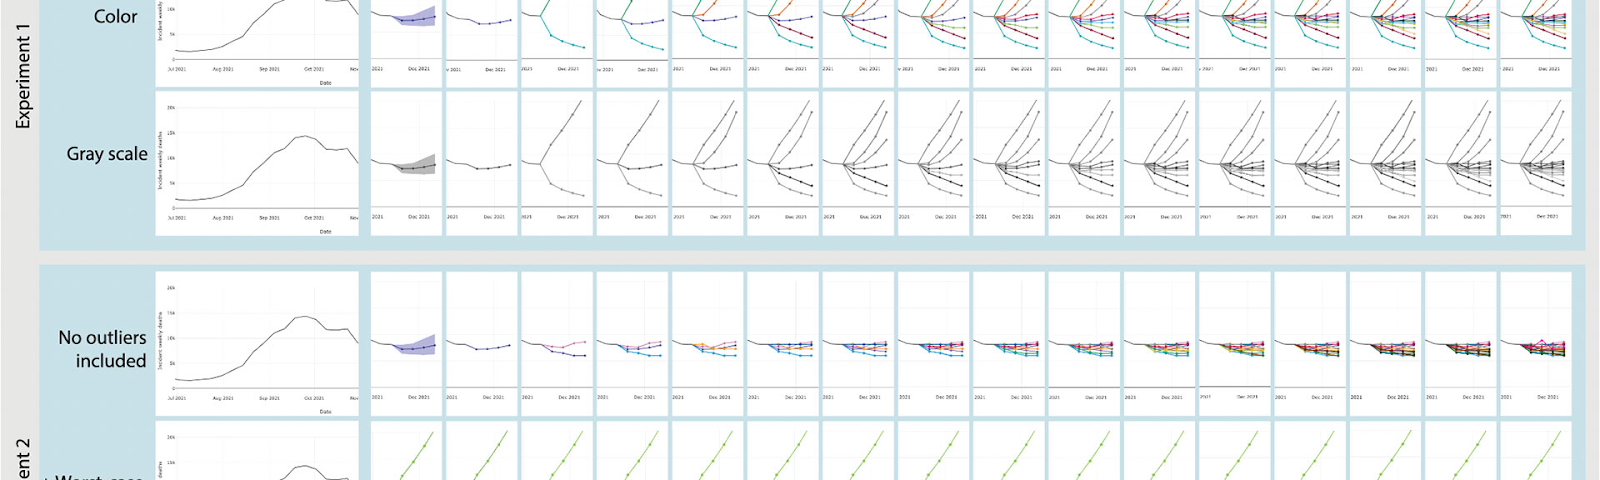
COVID-19 Multi Forecast Visualizations: Trust or Distrust?
Examining the factors affecting trust and…
Read more…
Atseng
in
VisUMD
Oct 27, 2023
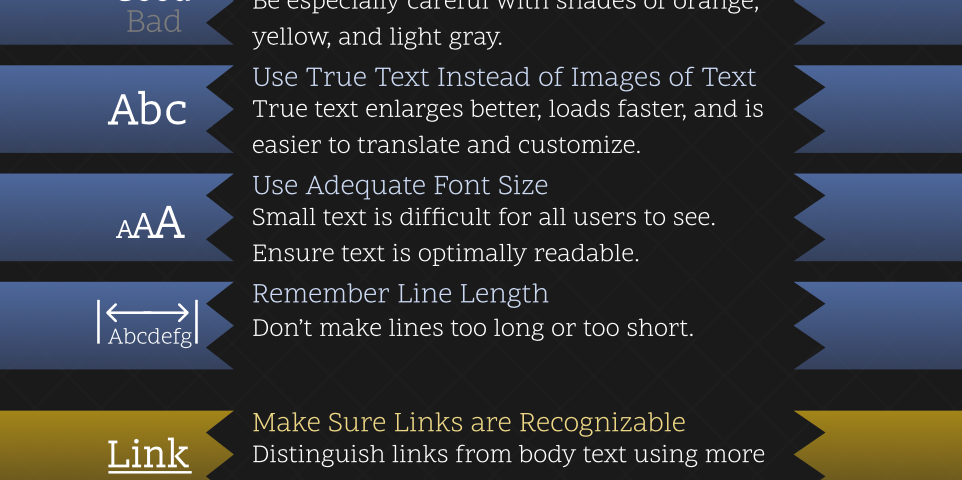
Empowering Accessibility: The Power of Words in Making Visualizations Speak for Everyone
Read more…
3
Sunakshi Jain
in
VisUMD
Oct 29, 2023
ChartWalk: A Tool for Visualising Complex Medical Records
A step towards easy navigation and…
Read more…
Abhijith Reddy
in
VisUMD
Dec 16, 2022
Anyone Can Visualize!
Natural language for authoring data visualization.
Read more…
4
Jong Ho Lee
in
VisUMD
Dec 14, 2022
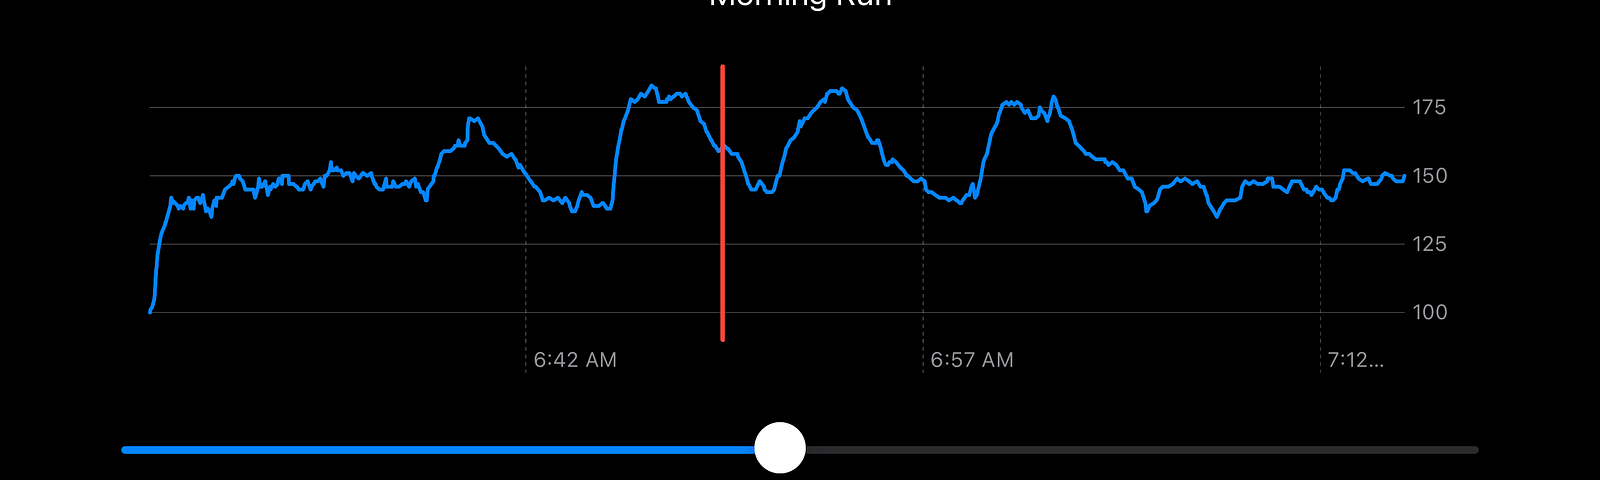
PokeCoach: A Multimodal Approach to Visualizing Running Data
Exploring Haptic and Audio Feedback…
Read more…
Sagar Chand
in
VisUMD
Dec 14, 2022
Verbalizing Vertices
Turning data in scatterplots into spoken words.
Read more…
Nghi Le
in
VisUMD
Dec 13, 2022
Adopt a Pet, It’s Pawsome
Visualizing shelter animal data from 2019 to 2021.
Read more…
1
Aishwarya Shettigar
in
VisUMD
Dec 15, 2022
A Day in the Neighborhood
Visualizing health justice in Baltimore City.
Read more…
Kristian Nicholas Koeser
in
VisUMD
Nov 11, 2022
At the Edges of Time
A new way to add visual context to time-based charts.
Read more…
Aishwarya Shettigar
in
VisUMD
Nov 12, 2022
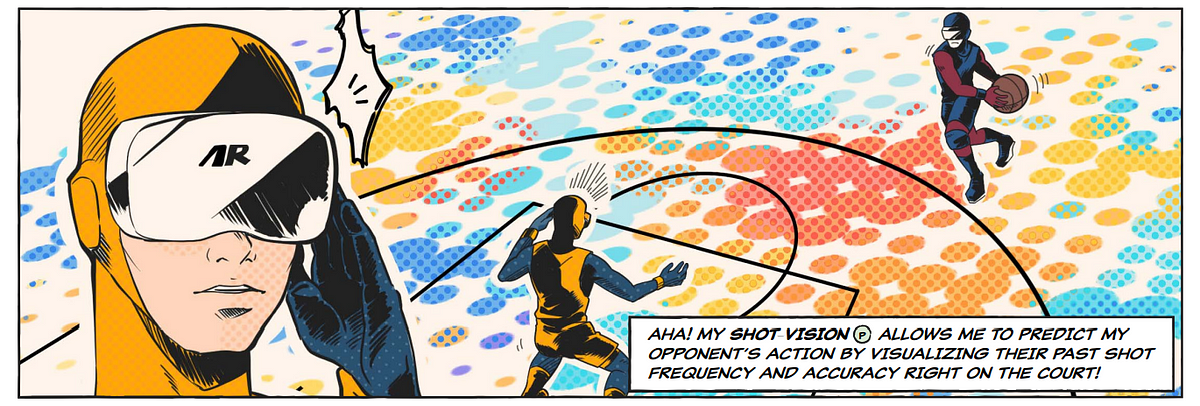
Harder, Better, Faster, Stronger
How visualization can become your personal superpower.
Read more…