Homepage
Open in app
Sign in
Get started
Tagged in
Dashboard
WVCode
Python, Data Visualization and GenAI
More information
Followers
1
Elsewhere
More, on Medium
Dashboard
Walter Ritzel Paixão Côrtes
in
WVCode
May 11
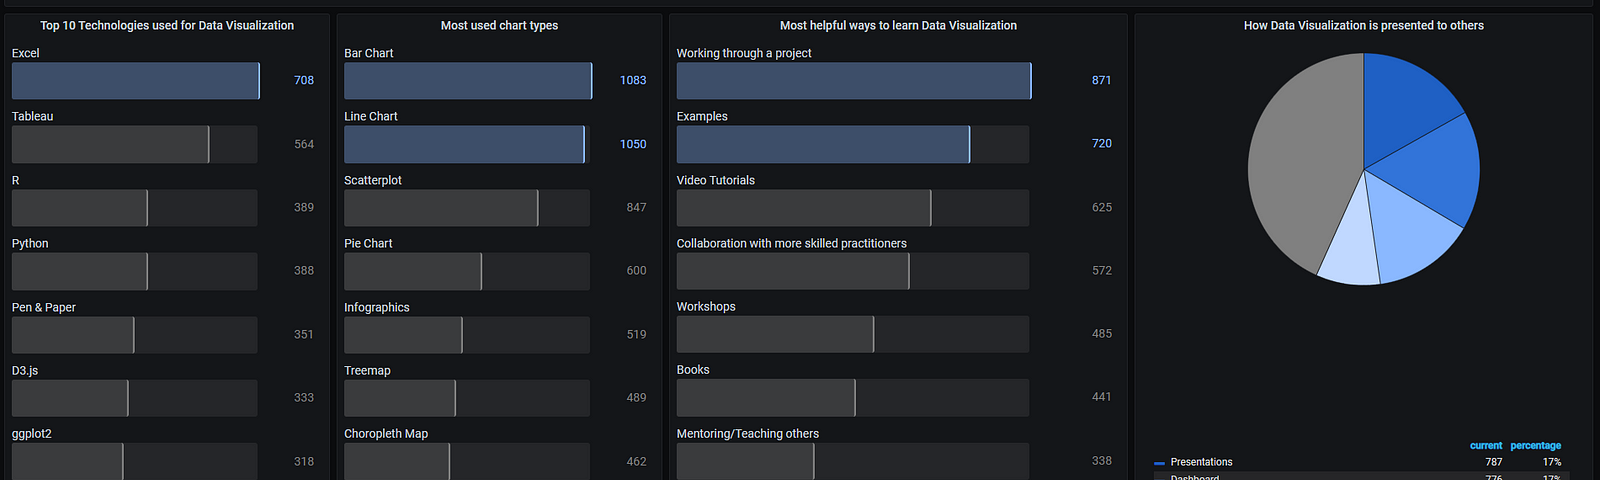
How to in Grafana — Part 2: Creating Interactive Dashboards
Exploring the interactive power of Grafana…
Read more…
Walter Ritzel Paixão Côrtes
in
WVCode
Apr 20, 2021
How to Use Grafana for Data Visualization
An open source platform for more than Observability…
Read more…
85
1 response