描述統計是透過圖表或數學方法,對資料資料進行整理、分析,並對資料的分佈狀態、數字特徵和隨機變數之間關係進行估計和描述的方法。描述統計分為集中趨勢分析和離中趨勢分析和相關分析三大部分。
今天給大家分享一些可以展示你程式碼的網站,它們都提供線上預覽功能,所以別人可以看到你的程式碼如何執行。它們有時候也被稱作“程式碼廣場”。
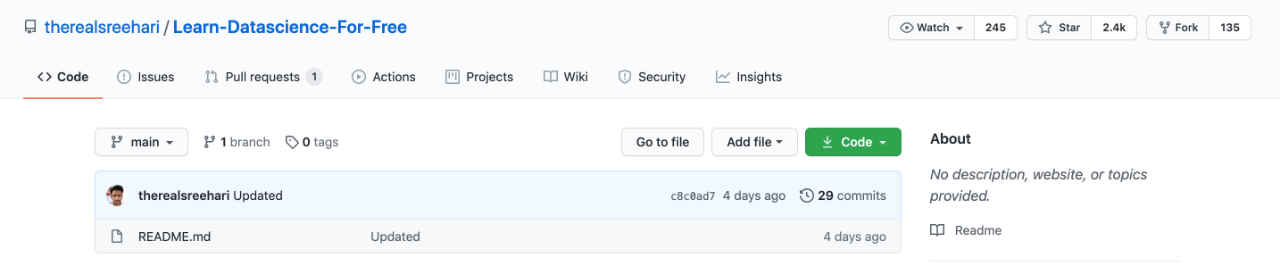
從頭開始學習資料科學的免費資源。
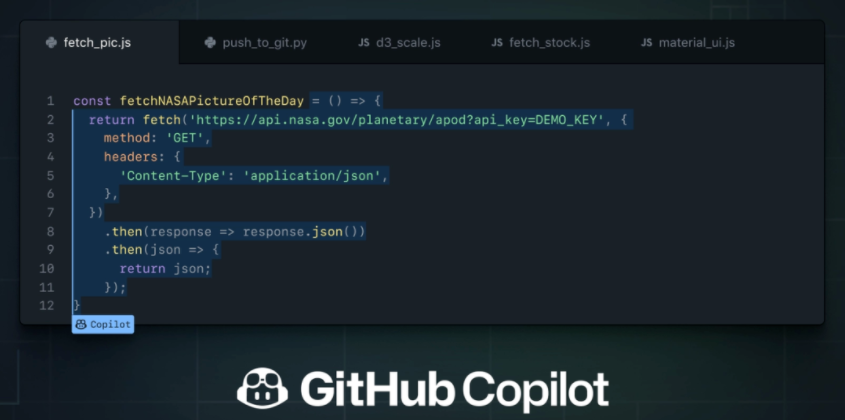
近日,GitHub 推出了一款利用人工智慧生成模型來合成程式碼的工具 — — Copilot,但釋出之後卻飽受爭議,包括版權爭議、奇葩註釋…
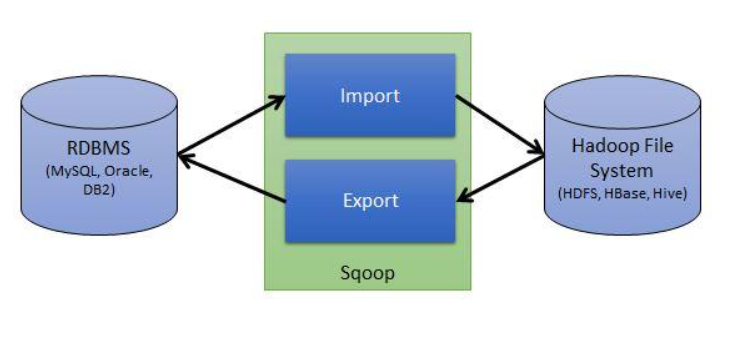
大數據包含太多東西了,從資料倉庫、hadoop、hdfs、hive到spark、kafka等,每個要詳細的說都會要很久的,所以我不認為這裡面有一個答案是合理的。
最近好多朋友都跟我說,現在網際網路企業裡的技術研發全都是白菜價,做市場的、做營銷的、做運營的都比做技術的要好得多,感覺國內很多公司都看不起搞技術的,事實上是怎麼樣的呢?
﹣什麼是資料庫﹣資料庫結構﹣SQL 概要﹣創建資料庫與表﹣刪除和更新表
所謂資料視覺化是指把資料以圖形動畫以及地圖等形式呈現出來,這樣即直觀又美觀,易於理解從而看出資料背後的問題。
@Datawhale
—開源初衷